Diagnosing intermittent “network” problems
There’s that one thing that customers usually ask, and that question is if I would be able to help diagnosing a problem on the network. My answer has two parts:
- If we can capture the problem situation in packets, I will find it
- When I find it, I’ll tell you if it’s a network problem (which, in my experience of over 10 years, is the case in only about 20%)
The trouble is: there are some problems where it’s not easy to capture packets, and that’s when you don’t know the correct capture location (usually meaning “there’s too many possible locations”) or the exact time for the packets with the symptoms to be recorded – or both.
The easy stuff
When a customer tells me “well, whenever I do this, the problems shows up”, I know that it won’t take long to diagnose the network. If the problem can be reproduced you can easily capture packets, simply because you know where to capture (at the persons PC/Mac/whatever it is) and when (while the person is doing whatever causes the problem). Those “easy” problems are the reason why most experienced analysts I know always carry a portable switch with a static or configurable SPAN port feature or a TAP in their laptop bags at all times. BTW, “hubbing out” by using a network Hub instead is an ancient technique and should be avoided at all costs (except in very special situations where the medium is still half duplex).
A word of warning to those still carrying Ethernet hubs: if I find out about you doing that in switched production networks, I’ll most likely make fun of you in my talks at the next Sharkfest! 🙂
The complicated stuff
If you have an intermittent problem the first thing to decide is where and how to capture packets. This decision is mostly based on what kind and number of capture devices you have, and what the network topology requires. In most cases the capture setup is a balancing act between choosing enough spots to have a high probability of capturing relevant packets and the number of capture devices you can deploy.
Some capture situations allow you to use SPAN ports, but in other cases you have to use TAPs, for example:
- if proof is required that all packets were in fact on the wire (can’t do that with SPAN because it may omit packets, leading to false results)
- if timings need to be measured as exact as possible (also requires a professional TAP with a built in high resolution timer, or simple TAP in combination with a professional capture device)
- if the traffic is too much for a switch to SPAN you may need to deploy filtering TAPs
The most complicated capture setup I ever designed in an enterprise level network analysis situation took about two weeks just to decide which devices to use in which location (I’ve mentioned this one in the first of the VMware capture posts already). It involved a huge virtual server cluster environment running DRS on fully automatic, with hundreds of ESXi servers. Plus there were quite a few network analysis nightmares like reverse proxies, forward proxies, load balancers and NAT gateways. A lot of the communication was SSL encrypted, and of course we had no access to the private keys. It doesn’t get more complicated than that (and we still helped the customer solve the problem).
One thing is pretty much always the same in situations like this: you’ll end up digging through tons of capture files with millions of packets. The biggest job my team ever analyzed had close to one TByte of capture files, in thousands of files. Now, how to analyze something like that? One thing is certain: you can’t look at all those packets in Wireshark, unless you visit the groundhog each day in the morning. You need to drastically reduce the amount of packets you’re going to examine first.
Reducing the number of packets to look at
The best way to minimize the amount of packets to look at you should have as many additional information about the problem occurring as you can, including
- the IP addresses of the computers/network devices involved in the problem
- the (more or less) exact time of when the problem showed up, which is not always easy to make really clear to the relevant users that are asked to report it. It’s often a problem to have them realize how many packets can “happen” in a minute, so make sure they report as close to the time the problem occurred as possible (and not like 15 minutes later when they find the time)
- “beacons” in the capture that tell you where and what to look for, e.g. a ping packet that a user triggered using a custom script when she/he noticed that the problem occurred (usually by clicking on an Icon on the desktop that executes the script)
- server logs with correct time stamps. That requires both the servers and the capture devices to have accurate system times set, of course.
Now, if you have access to commercial tools that are able to handle large file sets you can use those the help you digging through your captures, but that’s not always an option. Instead the relevant packets are often carved from the huge pile by leveraging tshark and mergecap scripts with read filters, e.g with a batch file containing something like
for %%a in (*.pcapng) do tshark.exe -r "%%a" -Y "display filter expression" -w "filtered_%%a"
mergecap -a -w all-packets.pcapng filtered_*.pcapng
First, tshark is used to read all files, then apply a display filter (working like a “read filter” in this case), and write the result to a new file. Afterwards, all the new files are merged together into one more or less big file (in Windows batch mode you need %%a, while on the command line you’d use just %a). The second step may be skipped or modified if the file gets to big to be opened in Wireshark, but it often helps to have as much details in a single file as you can. Keep in mind that the 64 bit version of Wireshark can open larger files than the 32 bit version.
Leveraging TraceWrangler
A new way of dealing with a large set of capture files is to use TraceWrangler. Right now most people knowing this utility think of it as a anonymization/sanitization tool, which is correct – but that’s not all it is supposed to do. Sanitization is only one of the things it can do, but the main focus of TraceWrangler is to help working with multiple files. So if you have a big pile of capture files you could add them to TraceWrangler (you may need the 64 bit version and a few GByte of RAM if you have a lot of packets) and have it scan them:
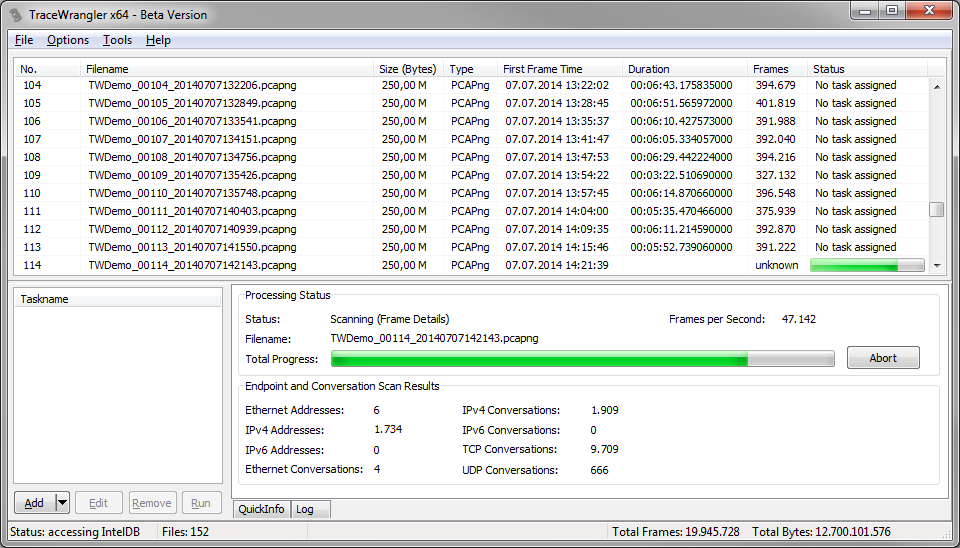
Now, open the “Communication Details” window via the “Tools” menu and you’ll get a endpoint and conversation statistic much like the one in Wireshark – but calculated over all files currently added to the file list, like in the following example (1.6 million TCP conversations, calculated over a total of 152 files of about 38GBytes with 59 million frames):
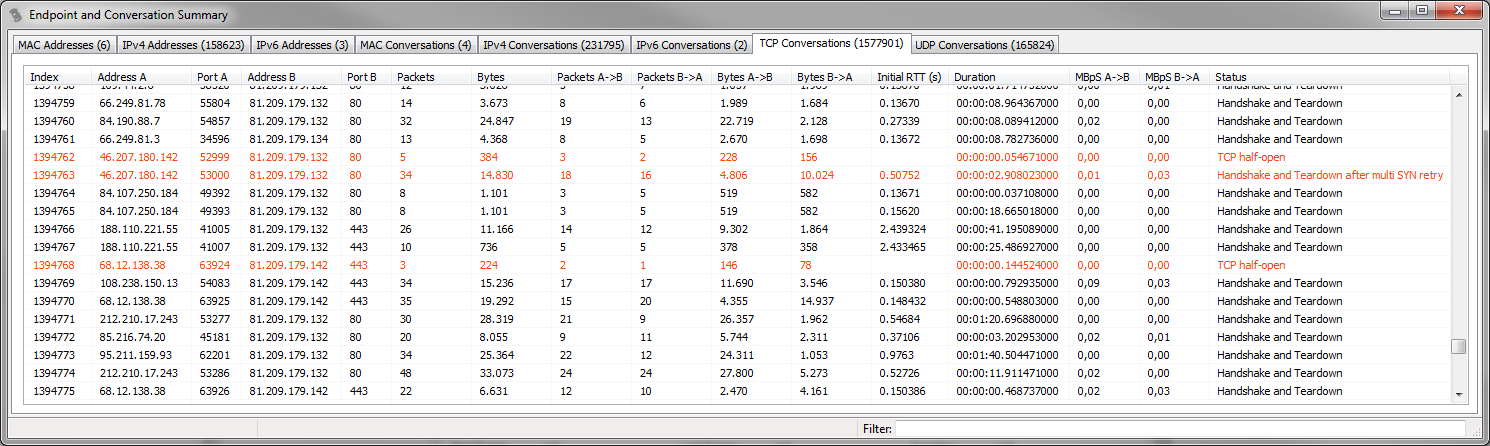
There are two additional columns in the TCP statistic window that you do not (yet?) see in Wireshark:
- Initial RTT: this column will show the initial round trip time (if available – meaning if the packets for the three way handshake are available). It’s often useful to sort the conversations by this column to find those that have a rather high iRTT – sometimes more than a minute. Wireshark doescalculate iRTT (since 1.12), but it’s not a sortable column in the conversation statistics yet.
- Status: in the status column TraceWrangler will tell you the general status of the conversation. It will not only show if there is a partial of complete handshake and tear down, but also if there are any other topics of interest. E.g. if a conversation spans multiple files, or if the frames have out-of-order timestamps or if you only have one side of the communication. There is a status column in the other tabs as well, but the one for TCP has the most details.
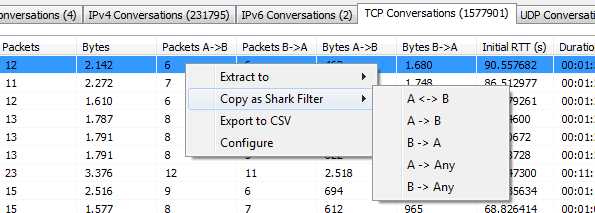
When you find something interesting, you can always use the popup menu to either copy a Wireshark display filter string to the clipboard and apply it in Wireshark, or you can extract one or multiple conversations to a new file (e.g. if you want to know why a conversation might have an initial RTT of 90 seconds):
I often leave TraceWrangler open and copy filters over to Wireshark, which is more convenient than picking filters from statistics windows of the same Wireshark instance.
Let’s assume we want to know why a conversation would need 90 seconds for the initial handshake. The easiest way to do that is to mark the TCP conversation and hit “Extract to -> single file”. After extracting the conversation to a new file it’s time to look at the packets in Wireshark:

Those 12 packets were easily extracted from a huge pile (close to 60 million) with a few mouse clicks. Of course it doesn’t always work as simple as that, but if you have some additional details like I mentioned in the bullet list above you can extract a lot without having to read tons of packets. It’s a good example of a very problematic session, where the client obviously suffers from heavy packet loss (the capture was taken right in front of the server).
Now for a small challenge: can you tell why TraceWrangler diagnosed a iRTT of 90 seconds from the screenshot above? And is that number correct, or do you think iRTT should be a different value (Wireshark 1.12.2 says iRTT is 6.122721 seconds)? Write a comment 😉
Packet 11 with Seq 82955 was the expected packet in 3rd position to finish the initial handshake, so the iRTT is really 90s.
Wireshark has been fooled by packet 5 to calculate iRTT, but this packet doesn’t correspond with a Seq of 84307 instead of expected 82955.
The only thing I don’t understand is the “Retransmission” message set for packet 11, though this packet doesn’t correspond to any part of data seen (Seq=82955 + TCP len=1228 = 84183 < 84307 which was the other Seq seen)
Any clue?
Looks to me like more segments are missing (and not found in the trace at all) between the segments in packet 11 and packet 5.
Of course the packet arrives later, but shouldn’t it be “Out of order” instead of “Retransmission”?
Wireshark marks it as retransmission because it arrives later than it should, and it’s not marked “out of order” because it’s really late (>3ms, when iRTT is unknown).
I think this is by far the latest arrival of a packet I have ever seen – probably a world record of 90 seconds 🙂
Thank you Jasper for another great article and insights of how to use TraceWrangler. Have to admit I used it for anonymization purposes yet only.
Based on SEQ numbers packet #11 seems to be the original 3way ACK, even though it’s already carrying payload. Packet #5’s SEQ number points out another 1353 Bytes I was not able to see in this conversation. I’m curious about your solution 🙂
Btw, what’s your preference for every day carrying, like SPAN capable switch or small TAP device?
Yes, looks like there is another segment missing indeed.
I carry various devices, depending on the task at hand, but I usually have a DualComm DCGS-2005 in my bag (nice because I can “abuse” it as a normal portable 4 port switch as well), plus – depending on what I plan to do – a Garland P1GCCA and a ProfiShark 1G.
DCGS-2005L looks quite neat, thanks for that. Are you aware of any German (or maybe European) distributor?
I’d have said eBay, but when I just looked there was nothing on the German page. Ebay.com has devices with shipping to Germany though. I usually bought mine at Sharkfest in the US.
… another reason to finally join you guys over there! 🙂
Seems like this swiss company got a few on stock:
http://www.wireshark.ch/de/
Interesting name though 😉
If you don’t mind buying online you may use Dual-Comm’s web shop. They do ship into Germany. There is also a German reseller (P&W) listed on Dual-Comm’s web site. But Euro prices are higher than USD prices from the U.S. As far as I know, wireshark.ch does not ship into Germany.
I can also recommend the ETAP-2105 from Daul-Comm which is a pure aggregation tap compared to the DCGS-2005L being a Gigabit switch with a fixed span port.
Great post, Jasper!
I am really curious about this one. Packet 5 shows the correct ACK number, but a higher seq number. There must have been one or two dropped packets between packets 4 and 5 with a tcp length of 1352 bytes. I assume Wireshark takes packet #5 as proof to show that there must have been a proper 3 way handshake.
I assume, Trace Wrangler also checks, if the Sequence number of the ACK is correct and finds it in packet 11. However, packet 11 shows an ACK number ending on 71680 instead of ending on 71679. I think packet 11 is a retransmission of the previously sent data (TCP time stamps increased) while the other side already had killed the TCP connection. Any different or additional clues?
Thanks Matthias, long time no see 🙂
Well, I’m with you on the diagnosis of Wireshark taking #5 as proof, since that sequence could only have been valid if the handshake was complete. TraceWrangler is a bit more strict and wants to see the exact sequence number, which only arrives in packet #11.
Packet #11 must be a retransmission (I even guess there are tons of them, and the one we see is the first that makes it through), because there is no way for a packet to be stuck for 90 seconds (90 seconds is eternity plus infinity it comes to network round trip timings). Unfortunately I have no capture from the client side (it’s a real world trace), but I guess there is packet loss like crazy, most likely on a cellular network with very bad reception.
Hi, so in this example, what was the fix ?
You mean for the problematic 90 seconds handshake? It was most likely caused by the client device being a mobile phone, having very bad reception. It’s not visible in the screenshot but if I remember correctly the GeoIP information for the client IP pointed to a cell phone provider.
In that case the fix would be “go to a location with better cell phone service, or find a WiFi you can use”.