Wireshark Column Setup Deepdive
Every once in a while I check the blog statistics for the searches that have brought visitors here. Most of them are more or less concealed versions of “how can I grab the password of others/my ex partner/my children/friends”, which comes as no surprise. Today I saw one search expression that I used as inspiration for this post: “Good Wireshark columns to have”. So let’s talk about them.
First of all, what are those Wireshark “columns” the search mentions? Well, this is how Wireshark looks like “out of the box”. The columns are showing the values of the packet list, which you see in the top pane of the window:

Figure 1 – Wireshark Columns in the top pane
Let’s walk through the standard columns in Wireshark and explain what they are doing and why you might want to keep them:
No.
The “No.” column shows a running number counting packets, from 1 up. You always should have this one:
- First of all it’s a good idea to be able to reference packets by their number if you’re discussing your findings
- It’s the only reliable way to sort all packets back to the order of how they were captured. If you think you can also achieve this by a relative or absolute time column as well, you’d be correct for most cases, but not all, e.g. when you have out-of-order arrivals on the capture cards. The reason why the correct order of packets is important is quite simple: the Wireshark TCP expert module processes packets in order of arrival, so if you can’t reconstruct the packet order you might get confused why it flags a packet as retransmission or out-of-order.
Time
This is the column of the default set we need to look at in great detail. It looks simple at first: it displays the time since the beginning of the capture. Right? Well… sometimes (this is a question for a “it depends” answer), because there is a menu option in the “View” menu that allows you to configure what the column actually shows:
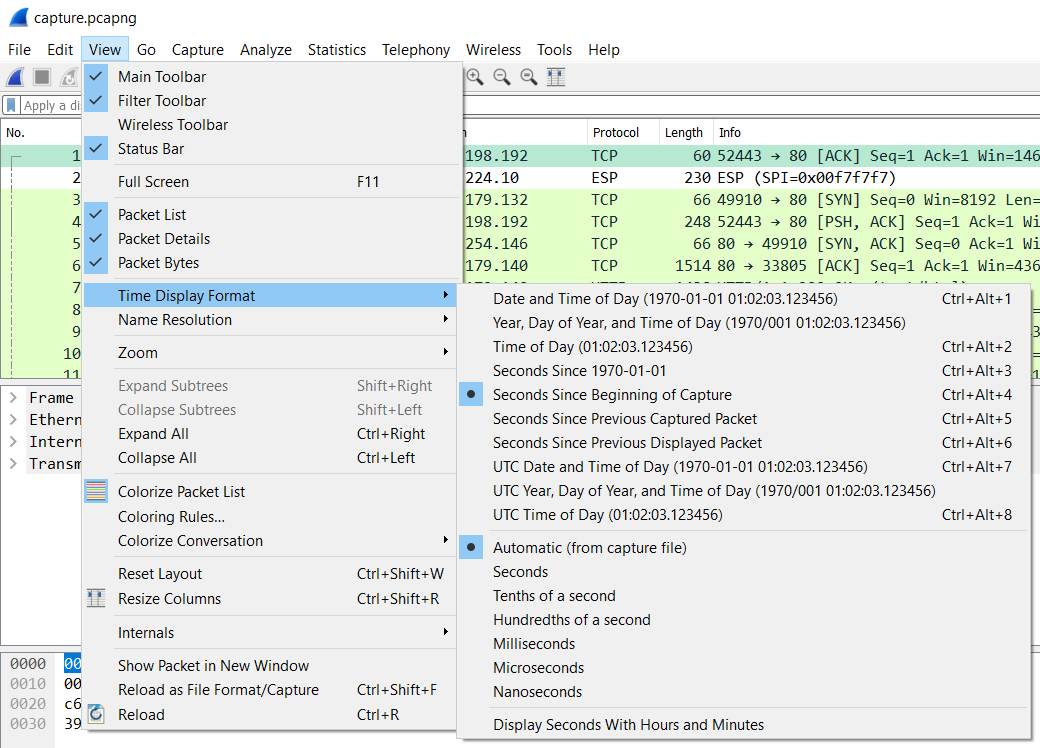
Figure 2 – Wireshark Time Display Format
As you can see, this column can display various time values for a packet. In general, there’s three formats that are mostly used:
- Seconds Since Beginning of Capture – you can think of this like a stop watch running during the capture and writing down the exact time for and when each packet is captured. This is also called “Relative Time” in many cases, because the values are relative to the point of origin, which is the beginning of the first packet by default. Oftentimes this format doesn’t seem too useful unless you want to know how much time passed from the start of the capture. But in combination with the option to set arbitrary starting points (called “Time Reference” points) this can be quite useful, e.g. when timing a TCP handshake to determine Initial Round Trip Time
- Seconds Since Previous Displayed Packet – this will tell you the time elapsed between the current packet and it’s predecessor. It’s also called “Delta Time Displayed”, because it doesn’t add up like the “Relative Time” does – it shows measurements between two packets, no more, no less.
Very important: there’s also a “Seconds Since Previous Captured Packet”, which seems to show the same values in most cases – until you apply a filter that hides the previous packet. In that situation the “captured” time value will stay the same, while the “displayed” time value will be adjusted to show the time from the new visible predecessor. I personally never use this one – I always use “Since Previous Displayed Packet”. - Date and Time of Day – this will show the absolute date and time of each packet, which is useful when you need to find packets based on a specific time something happened. The most important thing to know about this format is that the date and time may show unexpected values based on where the capture was taken and on which workstation you open the capture file.
Now let’s look at the precision settings in the same menu, which is set to “Automatic (from capture file)”. This part defines how granular the time values are displayed. Seconds are much to imprecise for most tasks, so you usually want Milliseconds and Microseconds, too. In general, the setting “Automatic (from capture file)” is fine, as it determines what precision the capture can provide and shows the time stamps with the same precision. This usually means that you won’t see Nanoseconds, because few capture devices can actually provide that kind of precision (in case you wonder: FPGA based capture cards and special devices like the ProfiShark TAP do).
Pro Tip: reading a time column in Wireshark takes some practice, but with a little training you can quickly tell Milli-, Micro- and Nanoseconds apart. If you see a time like 0.001166563 the only thing most people can specify right away are the seconds (because they are separated by a dot). Train your eye to split the part behind the dot into groups of three digits: 001166563. The first group are Milliseconds, the second is Microseconds, and the last are Nanoseconds.
Source and Destination
This columns may look like a no-brainer, but there’s more than meets the eye here. In general, these two columns display source and destination addresses, and you’ll be used to seeing IP addresses displayed for each packet. But sometimes you’ll also see MAC addresses:
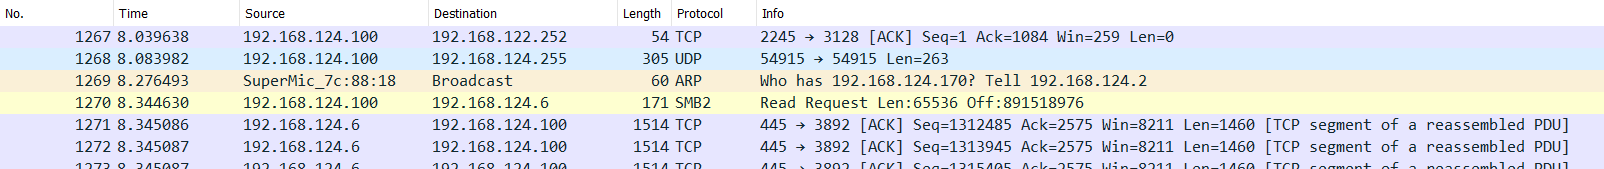
Figure 3 – Source and Destination column
The reason why there’s sometimes a MAC address and sometimes an IP address is simply that Wireshark displays the two highest layer address pairs it could find in each packet. So if there’s an IP layer, it will show IP addresses. For an ARP packet there are only MAC and no IP addresses, so that’s all we’ll see in those columns. That also means that when you have more than one IP layer you’ll only see the addresses present in the top IP layer, e.g. IPv6 for a tunneled conversation, and not the IPv4 addresses you might have expected to see:
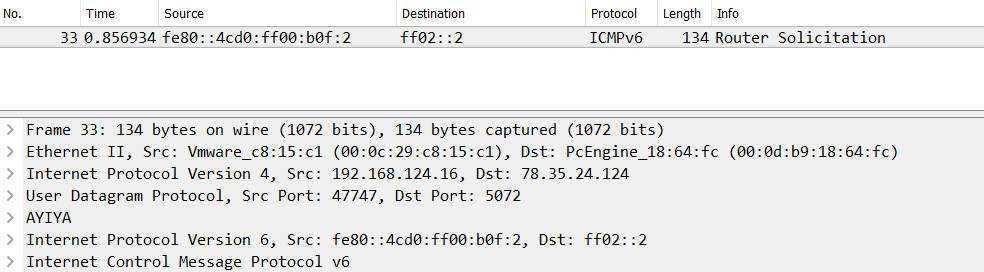
Figure 4 – Multiple IP layers in the decode
Pro Tip: you can use custom columns to show addresses other than those present in a higher layer. We’ll get to that later in this post in the Custom Column paragraph.
Protocol
The protocol column shows that top level protocol that Wireshark could determine. Sometimes it may be surprising that Wireshark will tell you something is “TCP” when you know that you’re looking at a HTTP session:

Figure 5 – Protocol Column showing TCP and HTTP
The reason why you see a lot of “TCP” values in the protocol column is that Wireshark can’t find HTTP content in all the ACK packets (they’re not carrying a TCP payload), so they’ll be marked as “TCP”, not “HTTP”. That also explains why filtering for “http” doesn’t display as many packets as filtering for “tcp.port==80”. Here’ a little homework for you: capture some HTTP traffic (hard to do these days, where everything turns HTTPS), and filter for “http” and then for “tcp.port==80”. Check the status bar for the number of currently displayed packets and compare 😉
Length
The length column tells you the size of each packet. The only thing special here is that in almost all capture files you’re missing the Ethernet Frame Check Sequence (FCS, a CRC32 check sum). So if you see packet sizes of 60 bytes there were in fact 64 byte. Same for 1514 byte sized packets – there had been 1518 bytes on the wire. Some capture devices do capture the FCS, but that’s rare and easy to identify because you’ll see no packet less than 64 bytes.
Info
The Info column contains details about the packet, once again depending on the highest layer that Wireshark was able to decode. It can be really helpful, or containing little value for you if it doesn’t show what you’re interested in. A very common question is “what can I do to change what the Info column shows”, and the answer is “very little”. You can force Wireshark to not decode the highest level protocol via the “Enabled Protocols” menu option in the “Analyze” menu, which is something I sometimes do if I only want to see TCP information, e.g. by disabling the “HTTP” protocol dissector for the same capture file previously shown in figure 5:
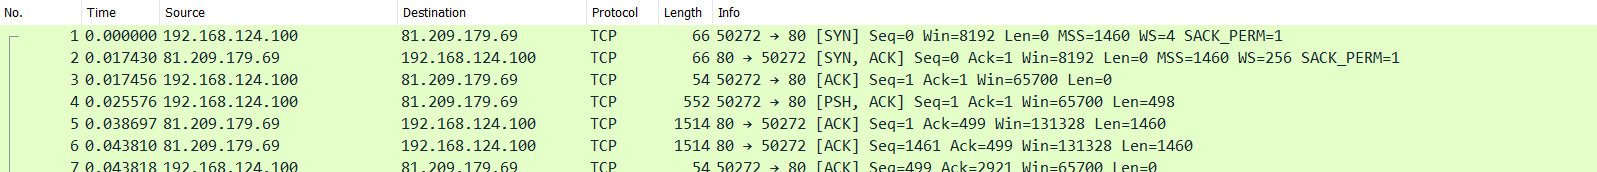
Figure 6 – Info column example not showing HTTP (HTTP protocol dissector disabled)
If you want Wireshark to display different things about the protocol it found at the top layer there’s just one way to go: grab your C compiler and the source code of Wireshark, and change the code. Or open a feature request, and maybe some nice developer will see that your request is useful and will implement it at some point in time. In can take a long time though.
Editing your column setup
There are couple of ways to edit you column setup. First of all, you can drag and drop the column headers left and right to rearrange them:
Figure 7 – Column Drag and Drop
You can also edit columns by right clicking on a column header and selecting “Edit Column” from the popup menu. The other way to do it is in the preferences dialog, which is also the place where you can add, remove, rearrange (via vertical drag and drop) and edit columns:
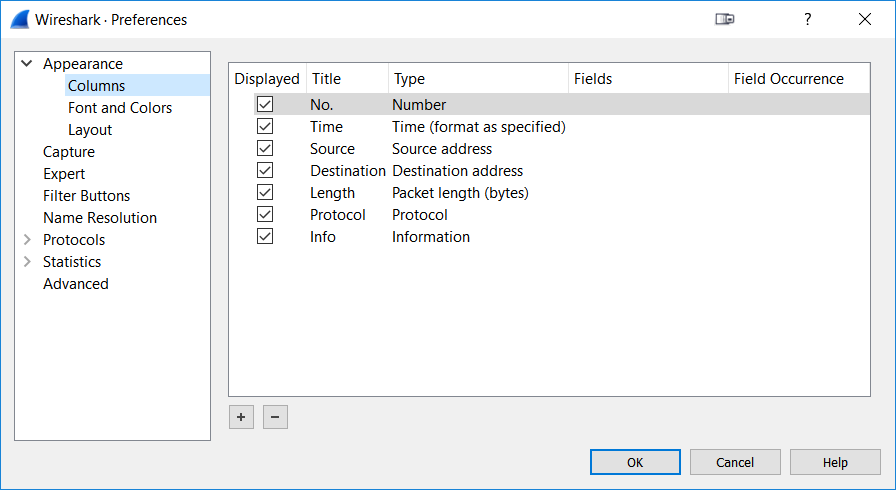
Figure 8 – Column settings in the preferences dialog
To add a column, simply click the “+” button at the bottom of the column list. Don’t wonder if there’s no additional settings are for the column like it used to in the 1.x versions of Wireshark – now you’ll simply get an additional row titled “New Column” which you can then modify to your liking. This is done by clicking on the title cell and type cell, sometimes repeatedly until it becomes editable. There is a number of predefined column types you can choose from, depending on what values you want to see in your packet list pane.
Pro Tip: If you can’t read the full name of the column type in the drop down box, resize the “Type” column itself:

Figure 9 – Adding a column and resizing the “Type” combo box
It’s a kind of Magic – Custom Columns
The selection of predefined columns is pretty good, but there’s often something you want to see in a column that doesn’t exist in the list of column types. For that, Wireshark offers “custom” columns.
The Basics
The idea behind custom columns is pretty simple: any value Wireshark can show in the packet decode pane can also be shown as a column. Let’s say I want to know which host name each HTTP request is sent to. There is no standard column for that, but I can get that value as long as I know the display filter syntax for it, which happens to be “http.host”:

Figure 10 – Adding a custom column for http.host
Sometimes Wireshark users are confused why a column doesn’t show values – keep in mind that when Wireshark doesn’t find the field of the column in a packet, it will not display anything. So in the case of the “http.host” column only HTTP packets with a host field will have a value present in the according column.
Also, there is an even faster way to add a custom column if you have a packet decode where you can find the value you want. In that case you can use the pop-up menu to quickly add a new column. The column will be placed to the right, which may cause it to be outside the current pane. In that case you need to rearrange the columns until you can see it, or resize Wireshark:
Figure 11 – Apply a field as column
If you want to you can even have a multi-purpose column that contains information from more than one field, e.g. if you want to show FQDNs from various name resolution protocols in a single column. A typical string to use for that custom column would be “http.host or tls.handshake.extensions_server_name or dns.resp.name”. Vladimir has a great post about this here. And while we’re at it there are also occurrences where you get more than one value in a column, which may be confusing, e.g. multiple TTLs. That can happen when a single packet contains multiple fields of the same type (the criteria is “matching the display filter”):

Figure 12 – Multiple comma separated values in a custom column
Pro Tip: use the “Resize packet list columns” button to help you resize columns and get to the new columns on the right, because it’ll also update the horizontal scrollbar (it’s the rightmost button on the toolbar).
Field Occurrence
When discussing the source and destination columns I mentioned that we can show more than one Source and Destination field if we need to. This can be done by using the “Field Occurrence” value of a custom column by specifying for each column which occurrence you want to display. Normally, the address columns show the values from the highest layer found in a packet. But with the occurrence index we can force Wireshark to show others as well. As an example I’ll configure two additional address columns to show the IPv4 carrier protocol for an IPv6 tunnel:

Figure 13 – adding columns with field occurrence
To be able to do that you need to add a custom column with the name of the desired protocol address field as value as you can’t use Field Occurrence on standard column definitions. The “Field Occurrence” field is used to set the index of the occurrence of the field in the packet decode, so “1” for the first, “2” for the second, and so on. Setting it to “0” shows all occurrences, separated by comma, which is the default. You can also use negative numbers for the index, making Wireshark count the occurrence from the last to the first, so “-1” would be the last, “-2” the second to last.
Pro Tip: If you try adding occurrence to standard column definitions they’ll turn into custom columns, and you need to fill in the filter value for the field if you want to use it that way.
Things outside the Box
There’s at least one other thing custom columns are very useful for: if you need to process data in a way that Wireshark can’t, e.g. creating a graph of IP TTL values. What you could do is use Excel or any other spreadsheet application for that kind of thing, but first you need to get the data out of Wireshark – and you can do that for any field values by using custom columns. Just add a custom column for the data you need, and then export your packet list to a comma separated value text file via the “File” -> “Export Packet Dissections” (a bit misleading, as you’re going to export the packet column data) -> “As CSV”.
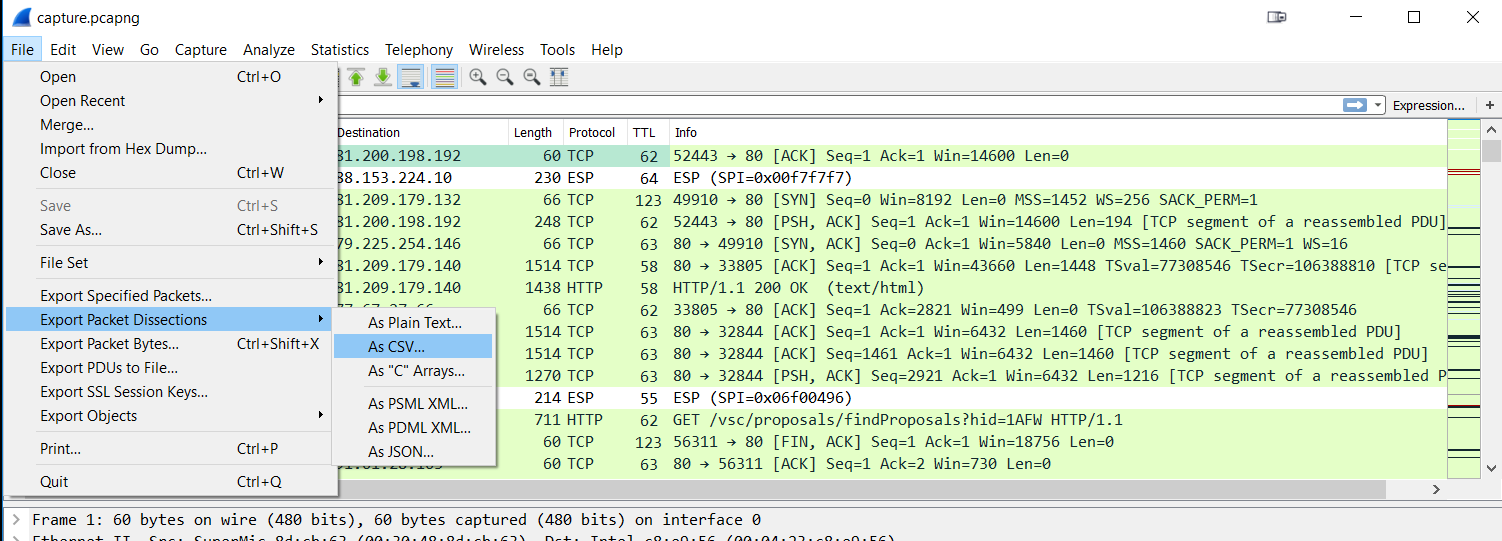
Figure 14 – Export column values as CSV
Just make sure that you uncheck the “Packet Details” checkbox, because otherwise you’ll have more than just the column values you want. After that, import the CSV file into your spreadsheet application and do whatever you want to do with the data. One of the coolest use cases for this was when years ago my team member Landi wanted to show that there was buffer bloat happening on a Cisco switch and he exported the bytes in flight to show that there was packet loss whenever the values went up past 100.000 bytes in flight – because that’s how big the buffer was, dropping packets when more bytes came in than it could hold. It was a perfect saw-tooth graph in Excel.
Removing columns
Removing columns is pretty easy: you either delete them in the preferences dialog, or via right click on the column header and selecting “Remove this Column” in the pop-up menu. One thing that may not be immediately obvious is that you can temporarily hide columns you don’t need, which is something I do a lot. Instead of creating multiple profiles I just add and hide columns, which is much faster (okay. I’m talking about a few mouse clicks here, but anything that slows me down is not going to happen :-)). For example, if I want to remove the TTL column for a while but may need it again later, I just uncheck it in the pop-up menu of the column header:
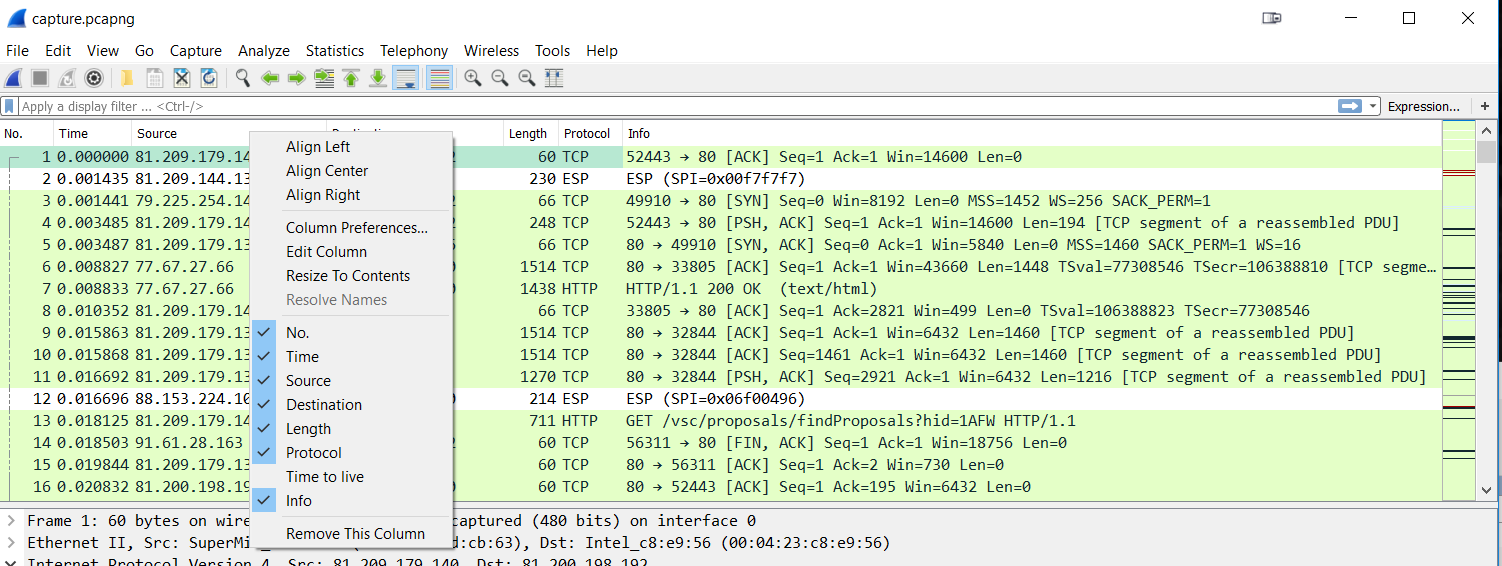
Figure 15 – Hiding a column
Final Words
When I setup my Wireshark configuration, I usually only add a few additional columns to the default setup:
- Delta Time Displayed, because I need to be able to see the time that passed between packets. In most cases that means something like “time between request from the client, and the response from the server”. Keep in mind that you need to isolate conversations via filter first. This column is absolutely critical to have if you do performance analysis or troubleshooting.
- Absolute Date and Time, because I often have to correlate packets with timestamps from other sources, e.g log files or notes taken during capture
- Cumulative Bytes, telling me how many bytes were transferred since the last time reference point
Other Wireshark gurus have a lot more columns than I do, mostly depending on what tasks they have to perform. If you do malware analysis like Brad Duncan from malware-traffic-analysis.net you probably need columns like http.host or URLs called, and remove No, length and protocol columns instead (for more on this check out his blog post that I only discovered an hour after publishing this article. duh!). For SMB analysis you’d go for columns telling you about SMB file access operations and error codes. Same for VoIP. TCP analysts often have columns telling them how long it took to ACK a packet, the next expected sequence number, or how many bytes in flight a TCP conversation has. My friend Hansang has a column set that boggles my mind when I see it, with about half a dozen of additional TCP values in custom columns. I prefer calculating them in my head and keeping them in mind, which may sound weird, but that’s how I work. I also have all my time columns on the right, because that’s what I’m used to (from my Network General Sniffer days).
And in the end, as Chris Greer put it in his great “TCP Fundamentals” presentation at Sharkfest 2018: you can’t just copy a profile (including the column settings) from somebody else, because everybody likes/needs a different set of columns for the tasks he wants to perform with Wireshark. But if you know what the columns are, you can build your own. And I hope this post helped a little with that. To get some more ideas, check out the Wireshark profiles repository. But don’t forget: you need to setup Wireshark your way, and your way only.
Very informative post Jasper. Column hiding is my go-to technique for column-rich profiles.
Thanks!
Hi Todd, thanks! You’re welcome!
Thanks for all your effort. I’m not a professional, just digging aimlessly into my network traffic. Your manner of presenting information is very pleasant, as an absoulte n00b I like the explanatory gifs a lot. I’m always amazed how many people are out there, sharing their knowledge. I appreciate it very much. LG aus Berlin 🙂
You’re welcome, thanks! 🙂
This is awesome exactly what I have been looking for, thank you so much for the awesome blog. For my understanding can you please explain (see below that I found from wireshark tutorial):
1- So basically if I want to see the time between two packets that would be the delta time option “Time since previous captured packet or displayed packet
2- But if want to see full time it took lets say for a TCP handshake I would need relative time
Thank you
• Date and Time of Day: 1970-01-01 01:02:03.123456 The absolute date and time of the day when the packet was captured.
• Time of Day: 01:02:03.123456 The absolute time of the day when the packet was captured.
• Seconds Since Beginning of Capture: 123.123456 The time relative to the start of the capture file or the first “Time Reference” before this packet (see Section 6.11.1, “Packet time referencing”).
• Seconds Since Previous Captured Packet: 1.123456 The time relative to the previous captured packet.
• Seconds Since Previous Displayed Packet: 1.123456 The time relative to the previous displayed packet.
• Seconds Since Epoch (1970-01-01): 1234567890.123456 The time relative to epoch (midnight UTC of January 1, 1970).
Thank you. And yes,
1 – you should use “Time since previous displayed packet” for the time between two packets. I never needed “time between captured packets” yet and have no use case for it
2 – for measuring time between non-adjacent packets you use relative time and set a time reference on the first packet before reading the relative time for last packet
Awesome thank you so much.
About my previous question I think this link answers it but I want to make sure my understanding is correct. Thank you:
https://blog.packet-foo.com/2014/07/determining-tcp-initial-round-trip-time/
I would add : DSCP and 802.1q !
Just saw your session recoring from Cisco Live, very interresting !
Thanks, glad you found it useful. Column setup very much depends on the task at hand and personal preferences, so feel free to add whatever you like 🙂
How about a shout out for ‘Identification’? (Packet Details Window > Identification > RightClick > Apply As Column ). 25+ years of using Ethereal and WS and only found this today 🙂 Game changer.
Hello, thanks for all your great work on this site. There’s one thing I’m not tracking on this though. The field occurrence still doesn’t make sense. So I looked at your pcap, does protocol hierarchy have something to do with why it doesn’t matter? I can’t figure out why I would use this still.
Thanks, Dan!
The field occurrence has nothing to do with the protocol hierarchy as far as I can tell. It’s only useful if you have more than one field with the same name.
So let’s say you want to see the IPv4 TTL (Time to Live). The field containing that value in Wireshark is called “ip.ttl”, which can be used as a colum. In most cases you only have one IPv4 layer in a packet, and that means you only have one field by that name. But if you have a second IPv4 layer in the same packet for any reason (e.g. in a tunnel or ICMP error message which quotes the offending packet) you’ll have TWO fields called “ip.ttl”, meaning two values. In that case occurrence is important: 0 means “show all values, separated by comma”, while 1 means “show the value of the first occurrence” and 2 means “show the second occurrence” in the column.
Ahhhhhh, ok, thank you!
Is it possible to add couple of bytes – let’s say 50th to 52nd byte of a frame as a column?
I don’t think so. I tried
frame[50:52]but the custom column doesn’t accept it. I’ll have to ask the developers if that’s expected.