Analyzing a failed TLS connection
Summary
This post demonstrates how to correlate two or more trace files to analyze a broken connection. We identify the root cause and gather information about the network topology. Tracefiles are available at http://www.packet-foo.com/blog/TLS/Skype.zip
We assume that the reader is familiar with TCP basics like session setup, retransmissions, window size etc.
The Task
Two servers running Skype for Business try to exchange information. The firewall log file documents that the connection is allowed. Still, the desired data exchange does not happen.
Network traffic was recorded on both servers. The Skype administrator has identified the TCP port number for one of the failed connections. We need to find the root cause for this problem.
Seasoned network engineers will quickly find the culprit by a careful look at the packet list of both traces. For those who are new to network analysis we use this blog post to introduce helpful Wireshark features and present a techniques to gather extra information about the network.
Available information
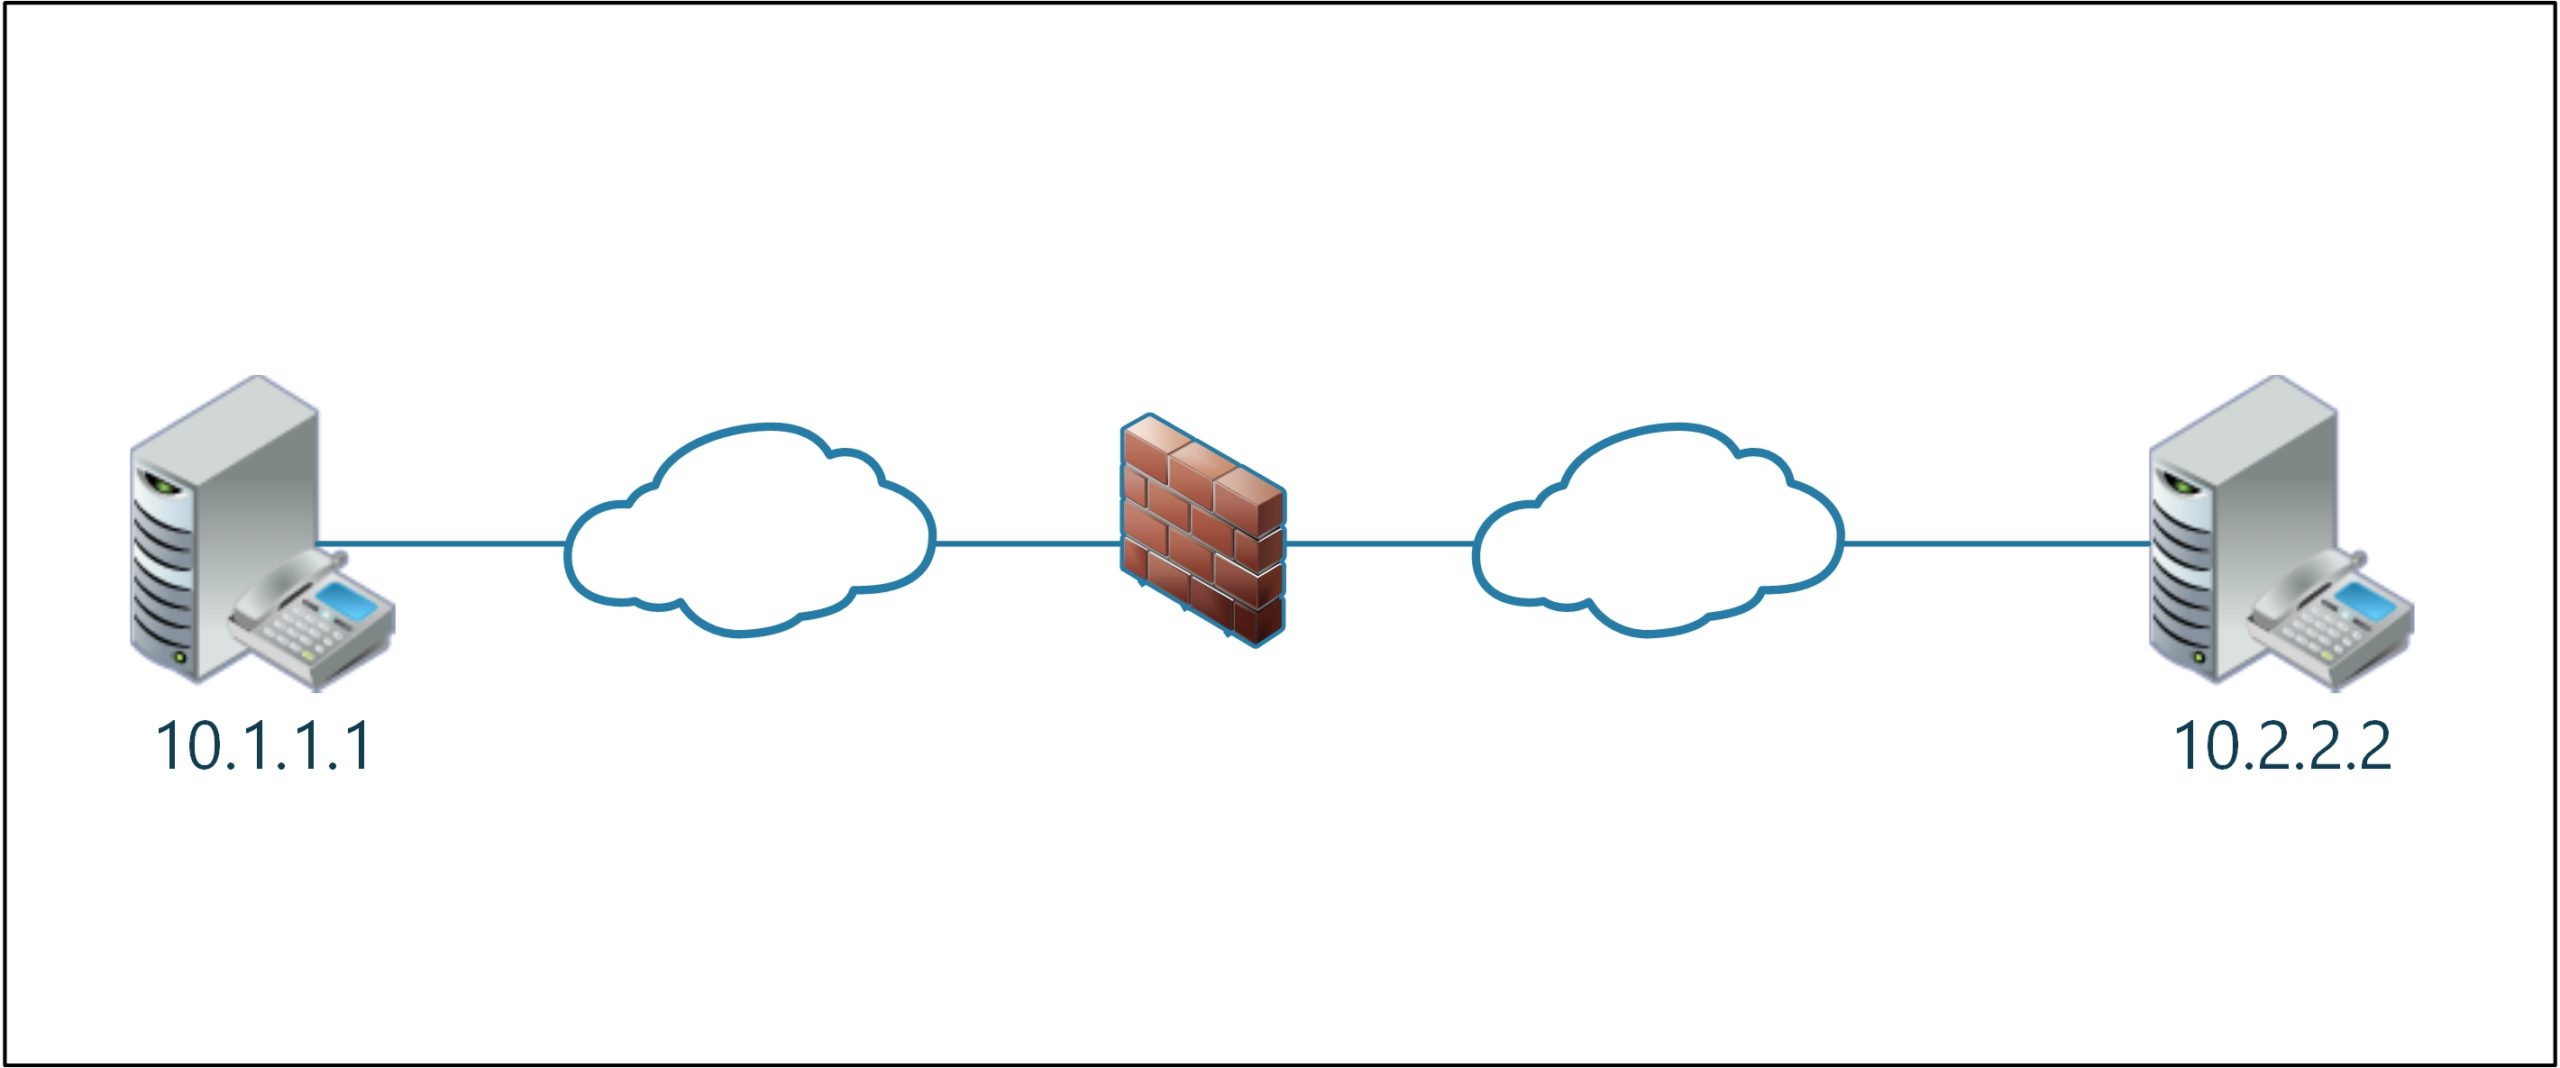
The two servers 10.1.1.1 and 10.2.2.2 are sitting on different network segments, one of them protected by a firewall. We will make educated guesses about the number of routers during the analysis.
The failed connection uses TCP port 53695 on the client side and port 5061 on the server side. Initially our network diagram looks like this:
We know from the firewall’s log file that the firewall permits the connection:
action=accept
service_id=sip_tls_authentication
src=10.1.1.1
s_port=53695
dst=10.2.2.2
service=5061
proto=tcp
Examining the Session Setup
When analyzing a failed connection I like to start with the session setup. Here is why: Both sides exchange a lot of important information in the first two packets. Segment size and window scaling are just two of the parameters.
Client-Side View – Session setup
Let’s find the faulty connection in our trace file. We already know that the failed connection uses TCP port 53695.
Once the client trace file has been loaded into Wireshark we have a number of options to navigate through bulky files:
- Hit Ctrl-F to open the search bar. Then enter the following display filter to locate the start of our TCP session:
tcp.port == 53695 and tcp.flags.syn == 1
If the trace file covers multiple hosts using this TCP port you might want to add an IP address to the filter.
- A display filter that only covers the server port (here: 5061) is likely to include multiple TCP sessions. That’s why we stick to the client port.
- If you know the frame number where the connection starts you can use Ctrl-G to navigate to the frame number that you already know.
In a more complex scenario you might want to mark interesting packets using Ctrl-M on your keyboard or Edit -> Mark/Unmark. It is very easy to navigate between marked packets using the keyboard shortcuts Ctrl-Shift-N and Ctrl-Shift-B or the respective functions found in the Edit-Menu.
Focusing on a single TCP session
Once we have located the session we can start the real work. While teaching Wireshark classes I noted that many engineers tend to focus on the session with the context menu “Follow -> TCP stream”. The function is great for troubleshooting plain text protocols. For a number of reasons I use it only later in the troubleshooting process, if at all:
- The function takes time when working with large trace files.
- Follow TCP stream is most useful when dealing with application layer problems in plain text protocols (or when Wireshark can decrypt the traffic).
- I don’t want to focus too much on this single TCP session – at least not yet. The filter will hide STP topology changes, routing updates, ARP storms and other interesting events.
Instead, I use a feature that seems to be somewhat underrated: Colorize conversation. Right-click on frame 47 and select from the pop-up window “Colorize conversation -> TCP” and click your favorite color.
I tend to use colors with a strong contrast between background and foreground. I also like the colors to stand out when using the Wireshark default color set. For this article the client connection is colored with option 1 and the server side is highlighted with option 6. Your personal preferences might be different.
Noteworthy details
Frames 47 through 49 reveal a few noteworthy details. First we look at the IP TTL field. IP stacks often (but not always) use the initial TTL of 255, 128 or 64 when transmitting a packet. Every router will decrement this number by one when forwarding the packet.
- The client TTL is 128. So we have to assume the trace was recorded locally or through a SPAN port on the same LAN segment.
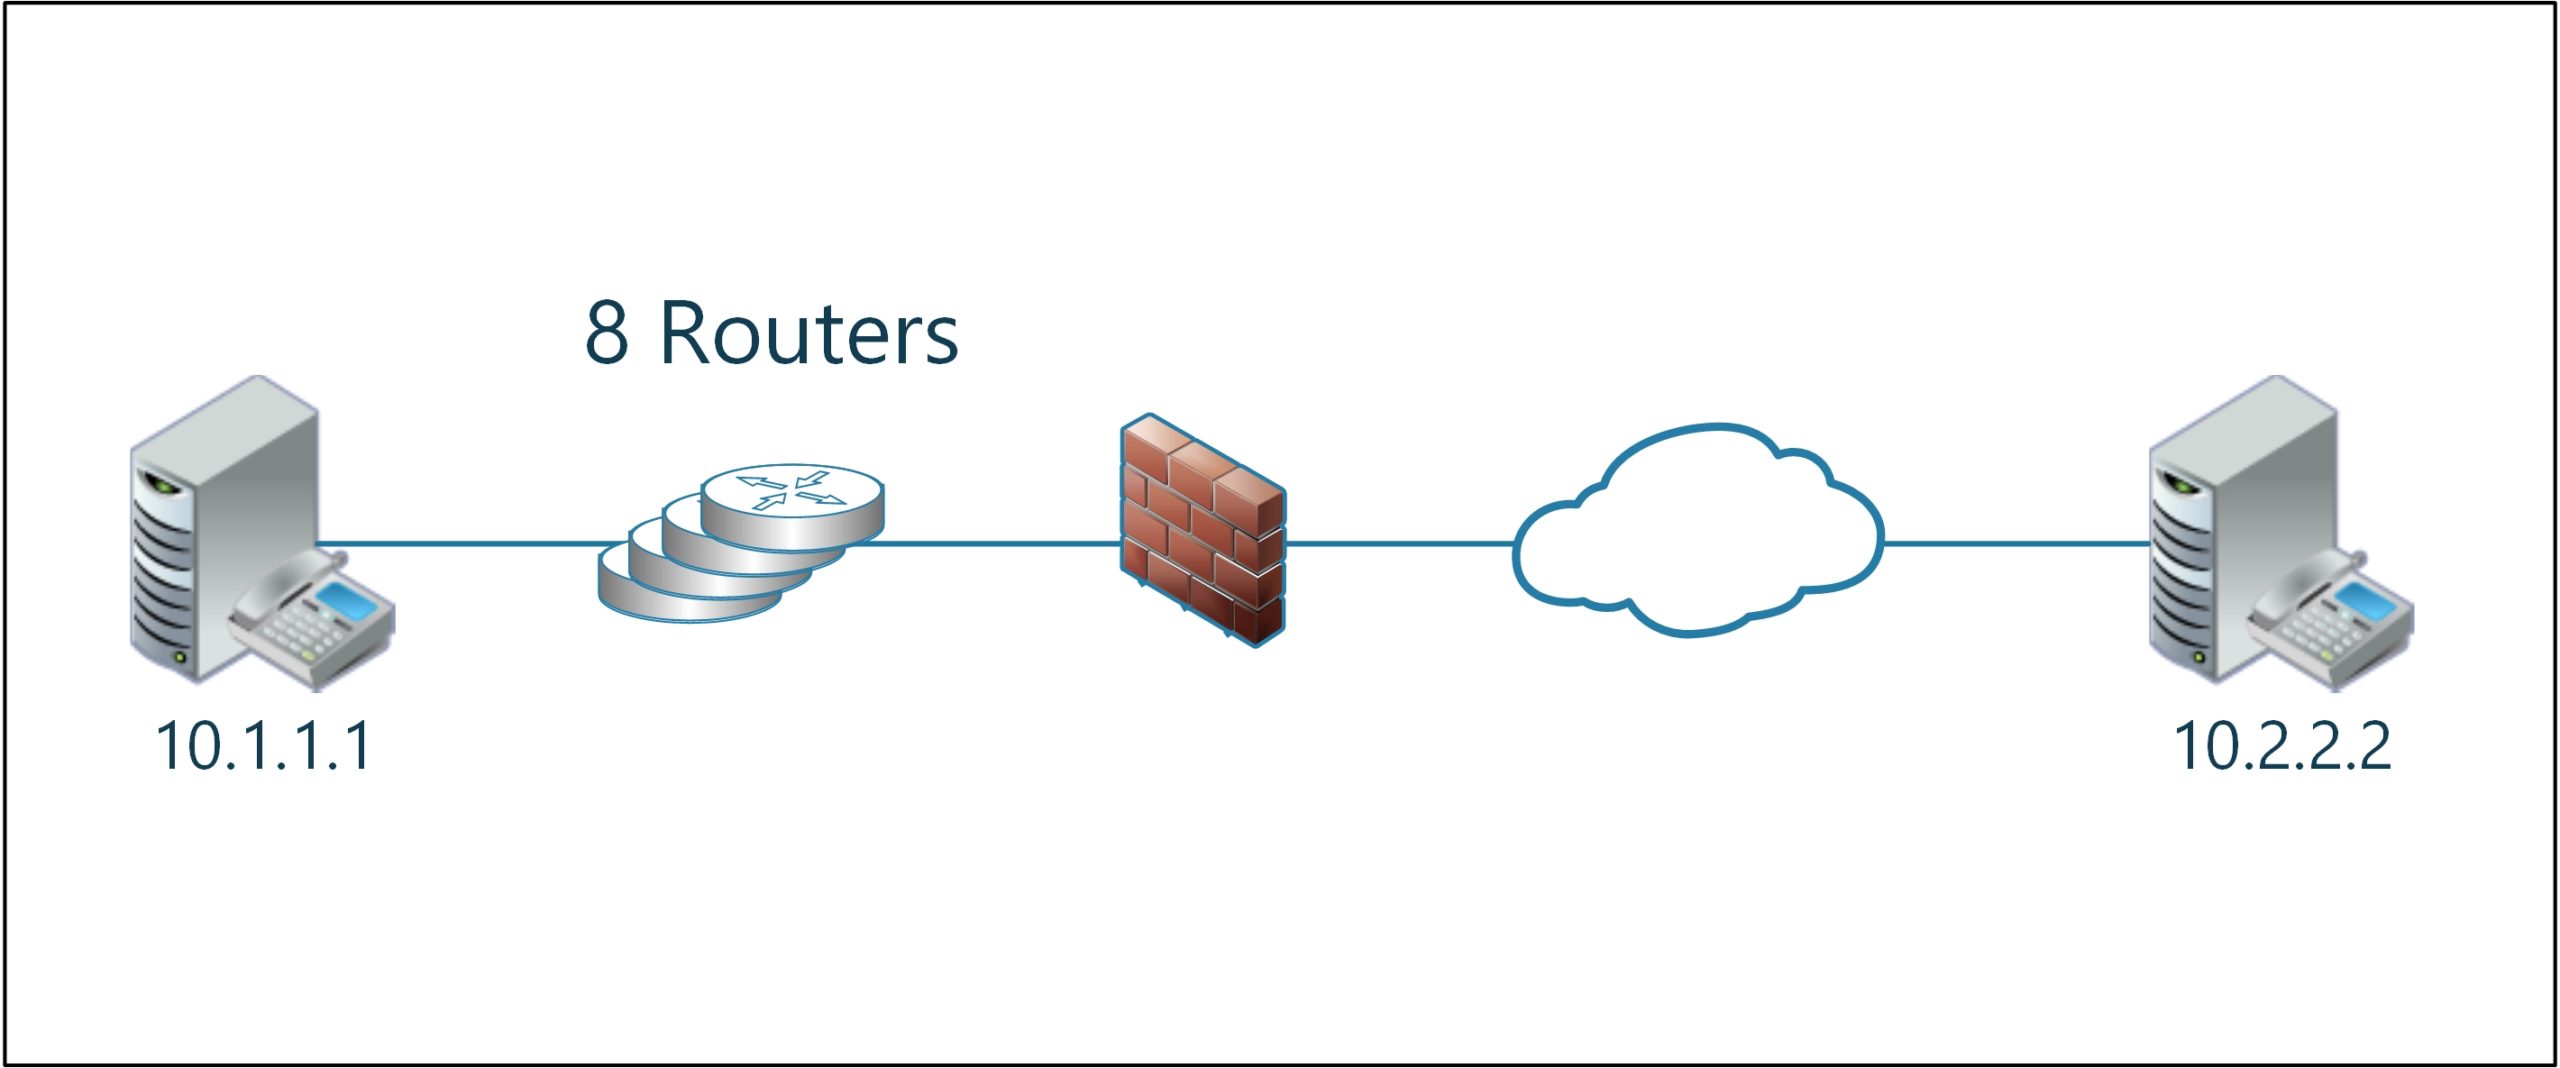
- The server TTL is 247. Assuming that the initial TTL is 255 we can infer that 8 routers sit between the client and the server.
Let’s calculate the round trip time (RTT) between client and server. The easiest way is by setting a time reference on the initial packet of the conversation. Click on frame 47 and press Control-T. The column “Time” will show the value *REF*. This technique is discussed in greater detail in an older blog post.
Next, locate the third and final packet of the three way handshake (frame 49). The time column shows the RTT between client and server: 0.003622 seconds. Most people will convert this somewhat bulky number to the more readable value of 3.6 milliseconds (msec).
Both sides define a maximum segment size of 1460 byte, support window scaling and selective acknowledgements. The client offers explicit congestion notification (ECN), but the server does not. None of the system supports TCP time stamps.
Server-Side View – Session setup
Next, open the trace file taken on the server side in a different Wireshark window. Repeating the same steps isolates the troublesome session: The function “Find Packet” (Ctrl-F) shows that the session starts in packet 24. Just as before with the client trace file I highlight the session using the “colorize conversation” feature, but with a different color.
From the server’s perspective things look a bit different:
- The RTT is only 0.3 msec.
- The SYN packet has a TTL of 255. Please remember that the client side revealed 8 routers and an initial TTL of 128. A TTL of 255 would put the “client” into the same subnet as the server.
- The ECN flag set by the client is gone.
The source MAC address for the initial packet (frame 24) belongs to a Checkpoint device. This would be the firewall sitting between client and server.
A number of details show, that the firewall is terminating the incoming TCP session and establishing a new one:
- The missing ECN flag is first visible feature
- Look at the client trace to see, that the client has advertised the window scale factor 256. The firewall has reduced the scale factor to 8.
- The server has transmitted the SYN/ACK with a scale factor 256. For the outgoing packet the also reduced the scale factor to 8.
- In the IP layer the packets have different IP ID
The IP ID (or IP Identification) is a 16 bit number that works a bit like a serial number, albeit it’s not a unique number. Depending on the TCP/IP implementation this number is increased by the sender for each transmitted packet or for each packet per connection, or it is just a random number. The important part here is that the IP ID changed while the packet was processed by the firewall. A router would leave this field untouched.
Sequence Numbers
Another tiny detail confirms, that the firewall has terminated the incoming TCP connection and opened a separate connection by itself: The sequence numbers.
In most cases I am happy to use the relative sequence numbers, that Wireshark presents by default. In reality the initial sequence number for a connection is a rather bulky 32 bit random value. Wireshark will the call first sequence number for a connection zero and present this as a “relative sequence number”. This makes it easy to reference lost packets. For me, it’s much easier to refer to a packet loss starting at sequence number 5000, than the 9 or 10 digit beast that the sequence number really is.
Once in a while the raw sequence number is rather interesting to look at. “Raw” refers to the real number transmitted over the network. Take a look at the initial sequence number chosen by the client, as seen in the client trace:
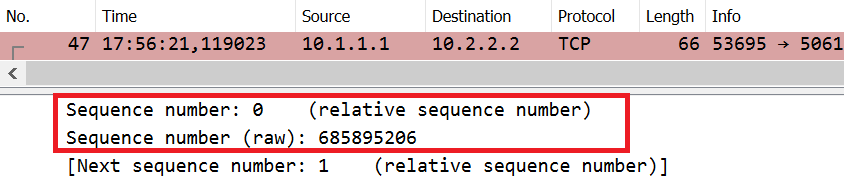
Note the raw value of 685895206. Now compare this to the number found in the server trace. Clearly, the firewall has chose it’s own initial sequence number. For the reverse direction we can observe a similar replacement.
Examining the Session Termination
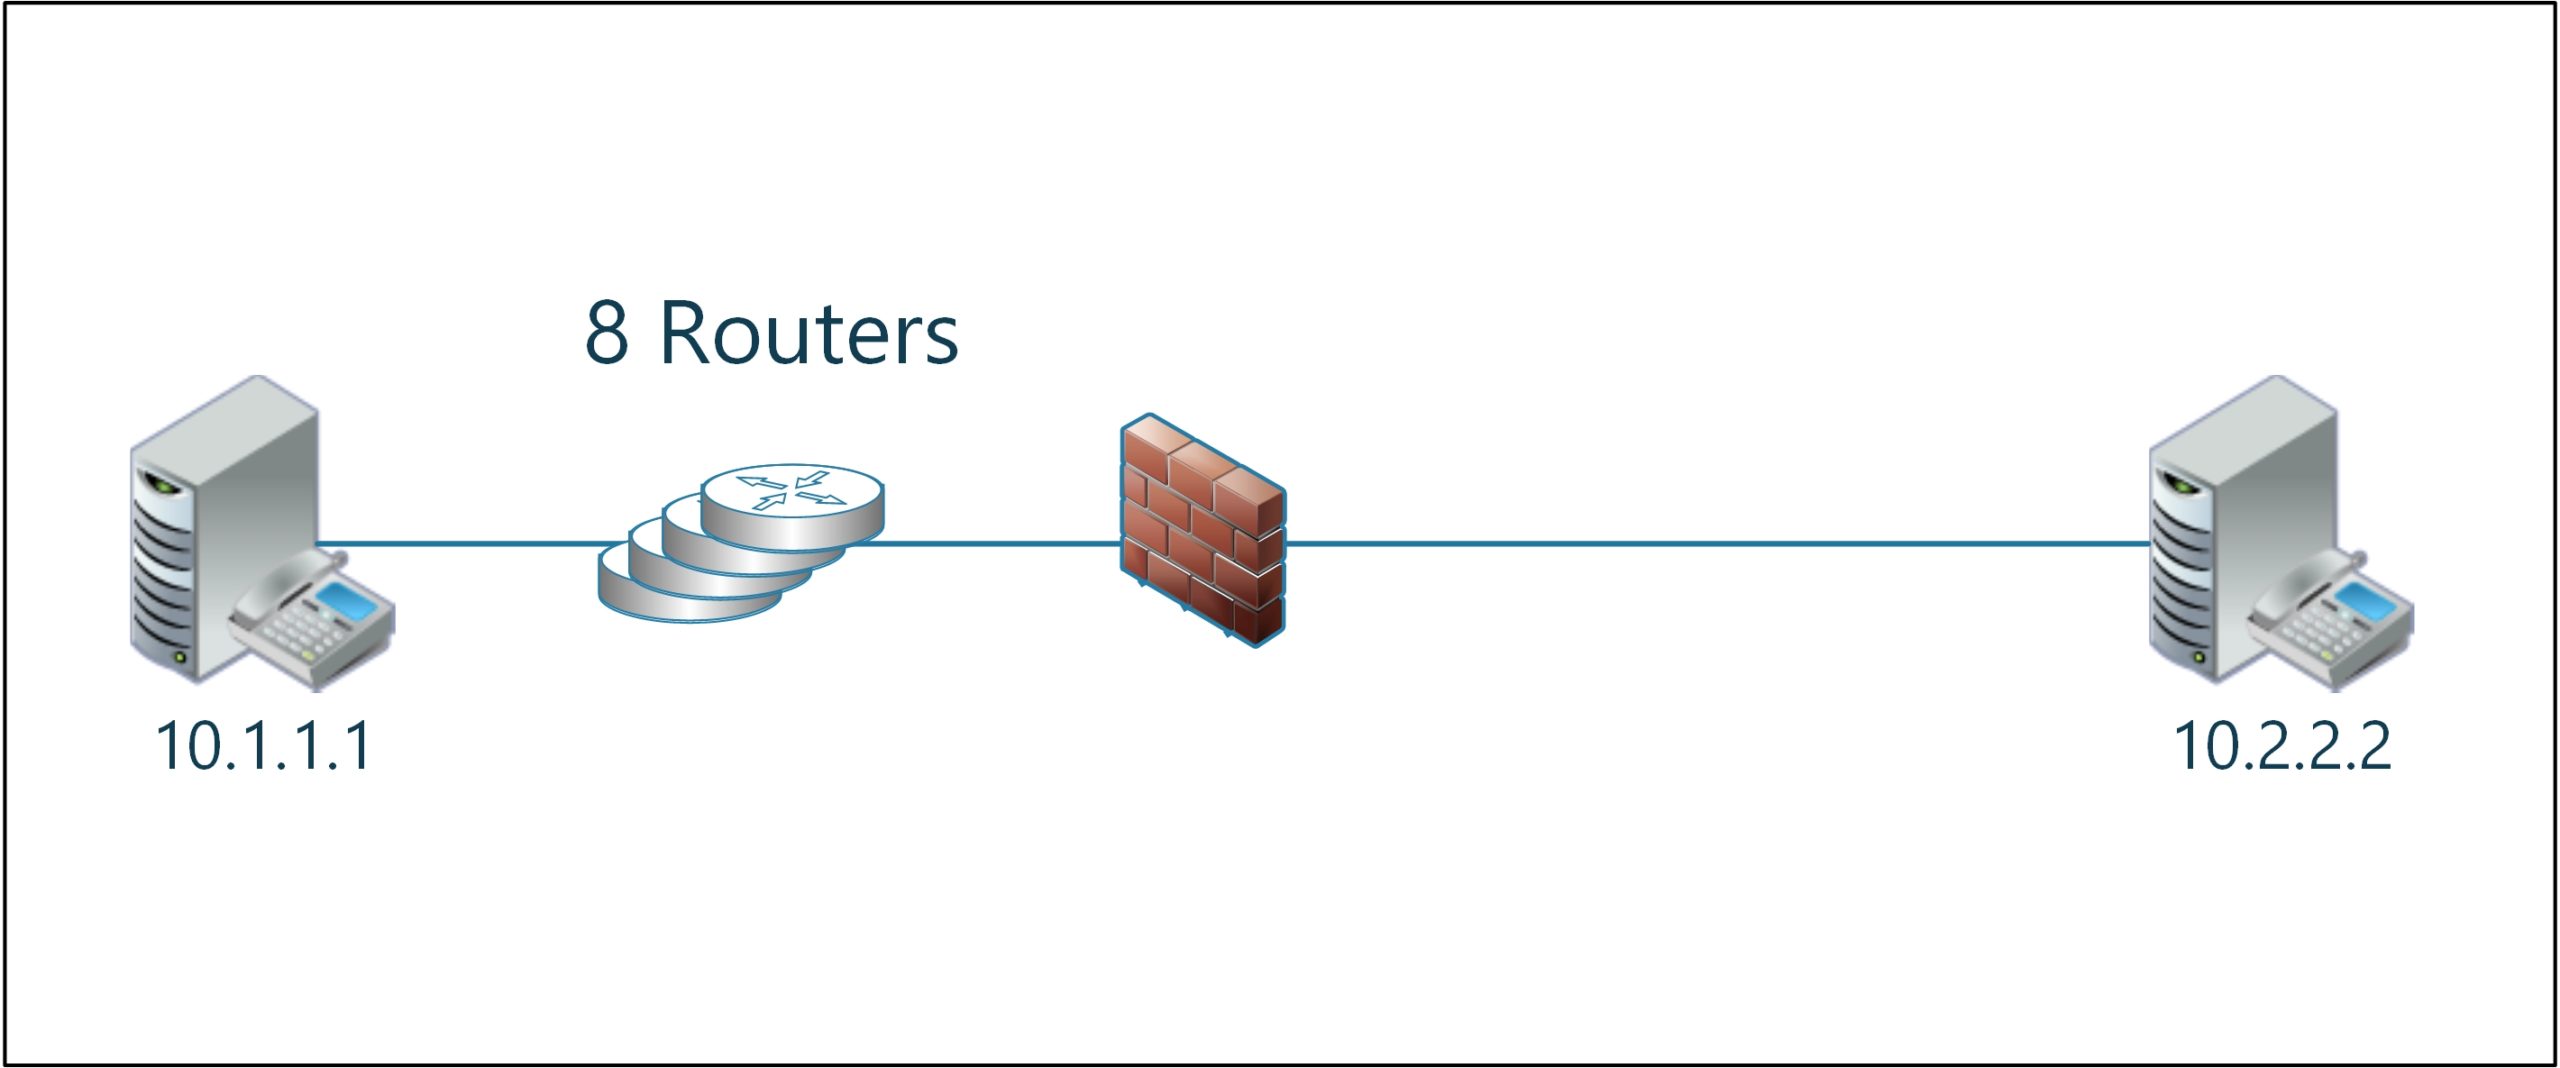
The analysis of the session setup gave some information about the network topology: We have an idea about the number of routers, we know the firewall manufacturer and round trip time. Another important detail is the conclusion that the firewall terminates the TCP connection.
Pro tip: More often than not network analysis is a team effort. Use a flip chart or white board to visualize these results, so that everybody else is aware of the details. The notes will help you to jog your memory when you return to the analysis on the next day.
Client View – Session End
Let’s go back to the client trace and take a look at the TCP session. This might be a good idea to learn about Wireshark’s stream index. When Wireshark reads a trace file it builds a number of tables to track the individual hosts and connections. For an analysis like this we can leverage the stream index which is unique for each TCP connection. The stream index is revealed in square brackets in the TCP layer. The square brackets indicate that this information was not transmitted over the wire, but calculated by Wireshark.
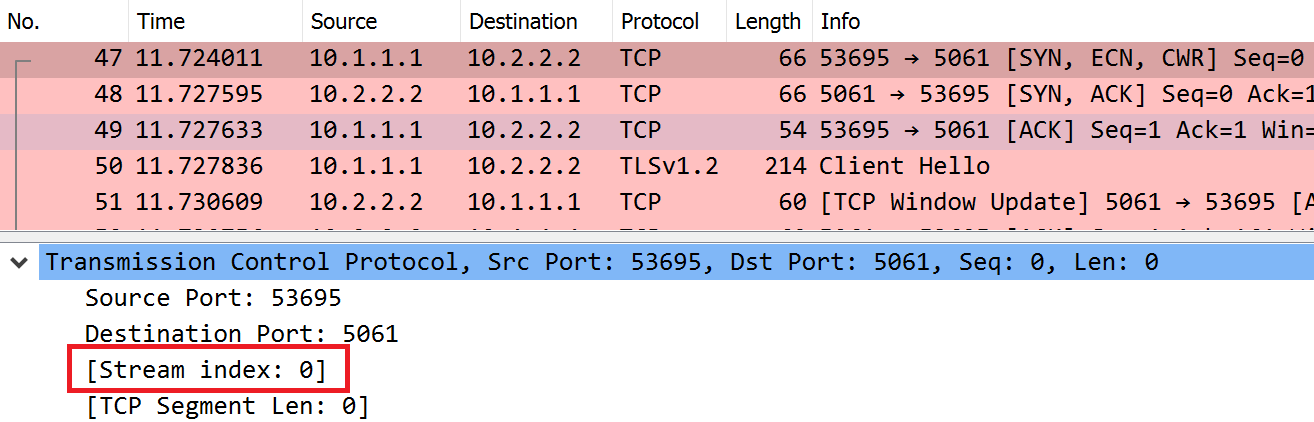
A right-click on the line with the stream index reveals the functions “Apply as filter” or “Prepare as filter”. Let’s go ahead and apply this stream index as a filter. Instead of a complex filter consisting of IP addresses and port numbers we have the simple statement “tcp.stream == 0” Cool, eh?
Since we have applied the filter Wireshark will hide all but the 9 frames belonging to TCP stream 0. Note that the server 10.2.2.2 is terminating the connection by setting the FIN flag in the TCP packet. This happens right after the Client has send its TLS hello. We cannot tell, why the connection was closed, but we know for sure it’s terminated by the server.
Server View – Session end
Now let’s repeat these steps for the server. Again, the questionable session can be found in stream index 0. Unfortunately, when working a case with multiple TCP sessions packets won’t line up as easy as the seen here. In packet 27 we see the familiar TLS hello from the client. The server responds with the Server hello, as it should be. Clearly, this packet never made it to the client. Instead the client responds with a FIN.
Now, wait. According to the client trace the server terminated the session. And according the server trace the client terminated the session. How can this be?
Remember the firewall? By analyzing sequence numbers and IP IDs we found out that the TCP session is terminated by the firewall. Effectively the firewall acts as a man-in-the-middle. Clearly it didn’t like the server’s response and terminated the connection.
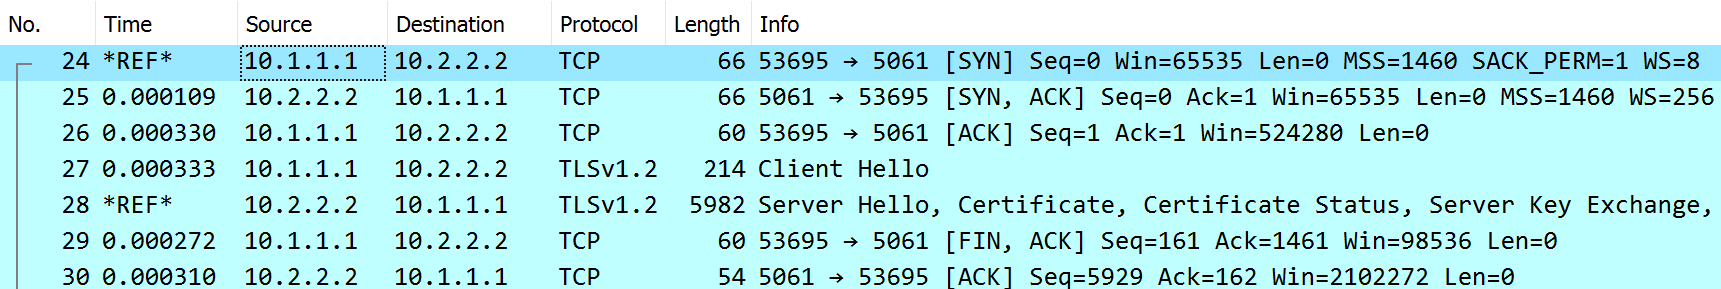
In the screenshot I have set another timestamp at packet 28, the “Server Hello”. Note that packet 29 with the FIN flag arrives with 0.2 msec or 272 microseconds. From the client trace we know that the round trip time is 3.6 milliseconds. There is no way, that this FIN flag comes from the client. Both the short response time and the IP TTL of 255 are strong indicators that connection was terminated by the firewall.
We don’t know yet why the firewall does not like the server hello. This is certainly a topic to discuss with the firewall administrators.
Wait, there is more
Further examination of both trace files shows that TLS sessions can be established successfully between the two nodes. Look at TCP stream 1 in the server trace. Hint: Remember the display filter? Try the display filter tcp.stream == 1 to isolate a successful session. The big difference between TCP streams 0 and 1 is the direction: TCP stream 0 is incoming (from the point of view of the firewall) while TCP stream 1 is outgoing.
The client trace covers a slightly different time span. Following the successful data exchange we see a two more failed TLS connections.
This is already a a good selection of topics to discuss with the firewall administrators: Multiple failed sessions and one successful session. But is it really the firewall?
Is it really the firewall?
If you take a really good look at the server trace you will notice something strange in packet 29 (the “Server Hello”): The packet holds 5929 bytes of data at the TCP layer. This matches the packet length in the IP layer (5968 byte). Unless we are using jumbo frames this would be an oversized packet.
Is it possible, that switch dropped the packet? Or that the firewall was offended by the packet because the maximum segment size is exceeded? Yes, absolutely, this is possible.
First of all, the successful connection shows two oversized packets frames (46 and 51 in the server trace). Since the data was acknowledged we have to assume that they made it through.
One thing helps to rule out the oversized packets: interview the person who created the Wireshark trace on the server. By doing so we learned that the Wireshark was installed locally. The trace was not taken by a SPAN port or a tap. The oversized packet is a result of TCP “giant send offload”ing. Since the server is running Skype for Business we can use the netsh command to verify the offload status:
[D:\Traces] netsh int ipv4 show offload
Interface 24: Ethernet
ipv4 transmit checksum supported.
udp transmit checksum supported.
tcp transmit checksum supported.
tcp giant send offload supported.
ipv4 receive checksum supported.
udp receive checksum supported.
tcp receive checksum supported.
Pro tip: A confirmed giant send offload is another point on the flip chart or white board.
Now we we make an appointment with the firewall folks.
Presenting the results
Analyzing the trace file often is only part of the work. I find it equally important to present the results to a third party. The audience might have another focus than networking. Attendees can be workstation or server administrators, database specialists, application developers or in our case firewall specialist. The tricky part is that they presented the firewall logs which would document a permitted session. We still have to convince them that there is some work to do.
Here is what I did: I loaded the trace files into two different instances of Wireshark. Then I used key-combination Windows-Left to put one Wireshark on the left side of my screen and the other instance on the right side. I made sure that the packets from the handshake and the client side are nicely lined up. This makes it easy to follow all the steps of the communication. Since both TCP sessions are marked in different colors it is easy to differentiate between the client and server view.

The final touch in this screenshot is a mouse click on the packet with the server hello, which highlights this packet. In the client trace I have highlighted another packet that is conveniently not part of the screenshot.
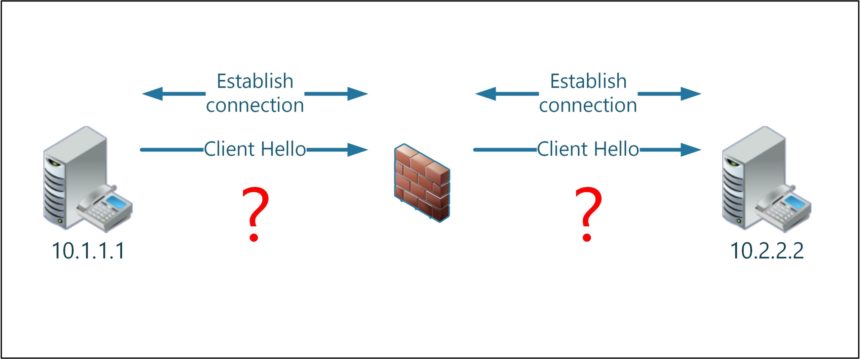
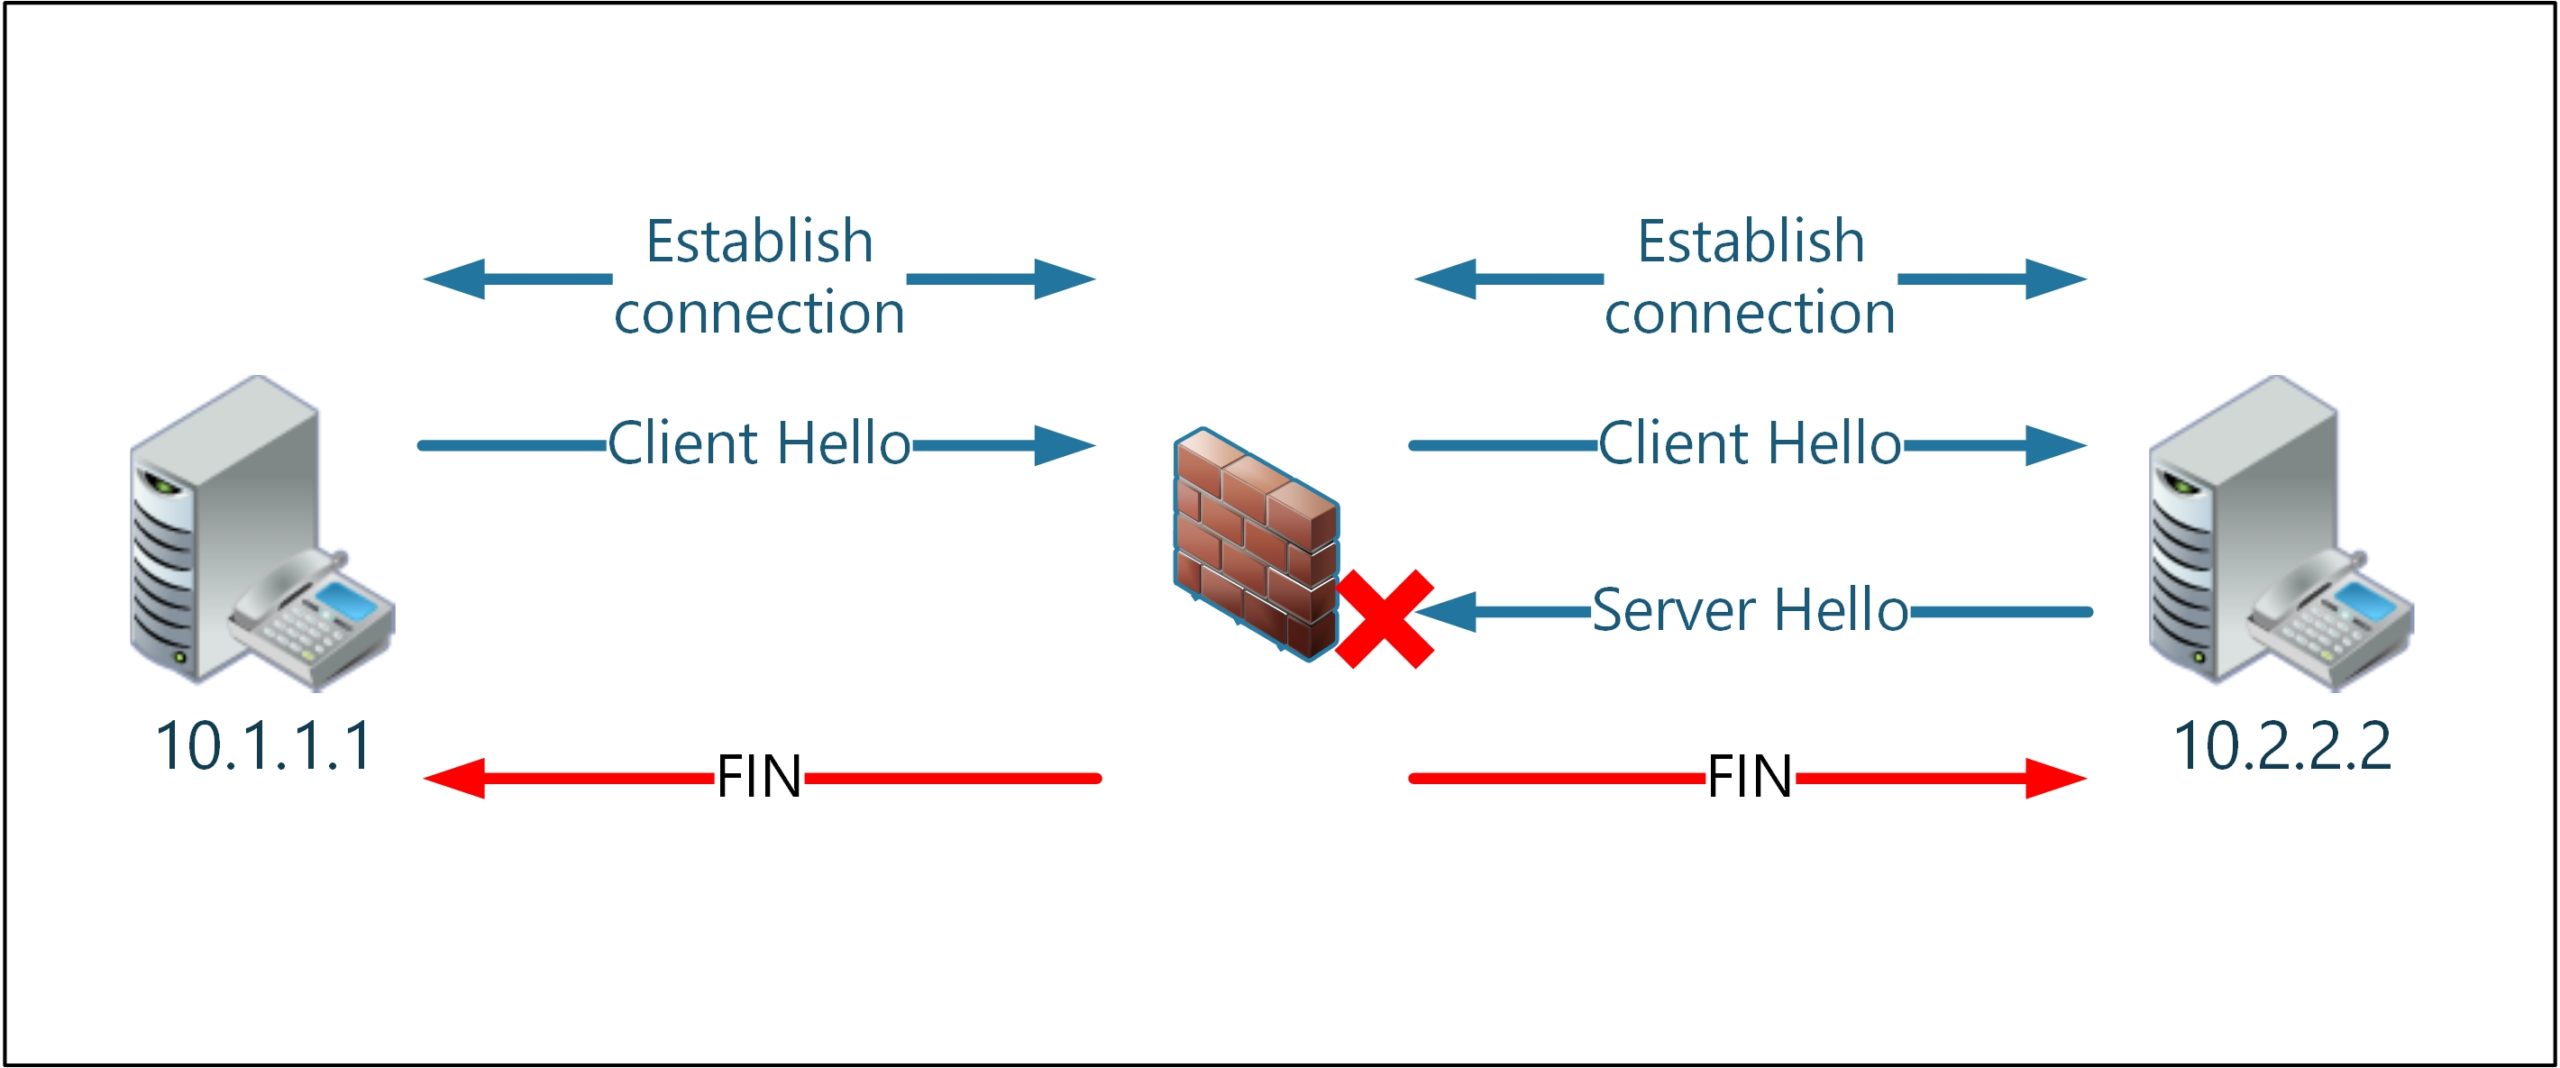
It might be that you have to present the situation to a non-technical audience. Depending on the damages caused by a network outage you might even have an audience with a board member. Here is one way to describe the situation to a non-technical audience in a single screenshot. Note that we intentionally simplified the TCP connection setup.
Sufficiently prepared we arrange a meeting with the firewall engineers. Occasionally folks will feel offended because we tell them that something went wrong with their equipment or their code. Things might get more complicated when previous encounters have soured the relationship between different teams. Luckily, in this case we did not have any animosities, but a rather friendly and cooperative work environment.
We just had to ask them to take another look at their log files, suggesting that there might be more log files around, or the TCP session could turn up multiple times in a log file. The search turned up this information in the log file:
action=drop
service_id=sip_tls_authentication
src=10.2.2.2
s_port=5061
dst=10.1.1.1
service=53695
proto=tcp
voip_reject_reason=TLS connection has to be closed
voip_reason_info=Encrypted VoIP signaling over TCP is not allowed
voip_config=In order to allow the inspection of encrypted SIP over TLS connections, please add the 'sip_tls_with_server_certificate' service to the relevant rule,
(+) make sure that the 'sip_tls_authentication' service is removed from the rule and configure TLS on the corresponding SIP Server object
voip_log_type=Reject
content_type=VoIP Session
The log file is pretty self explanatory. Everything went fine once the configuration was changed. Case closed.
Key points for take away
For this analysis we used a few Wireshark features which are often overlooked:
- Navigate trace files with the key combinations Ctrl-F and Ctrl-G (or menu Edit -> Find packet and Go -> Go to packet if you prefer to use the mouse)
- Colorize relevant conversations using the pop-up menu Colorize Conversation
- Use the TCP or UDP stream index to focus on a single conversation
- Set a time reference to measure round-trip and response times (Ctrl-T or Edit -> Set/Unset Time Reference)
The following fields in the IP and TCP header helped to identify the firewall as man-in-the-middle device:
- Measure the RTT between client and server by comparing time stamps between the first and last packet of the three-way handshake.
- The TTL is a good indicator to guess the number of routers between the endpoint. Note that VPN tunnels, MPLS networks and similar techniques will not change the TTL.
- The IP ID changed while the packet was moved through or rewritten by the firewall.
- The firewall removed the ECN flag.
- The TCP sequence numbers changed.
Network analysis is not only about bits and microseconds.
- Present your findings in manner and technical detail that matches your audience.
- Adapt your wording to the technical level of your audience.
Last Words
You might guess that the PCAP files were heavily redacted. TraceWrangler was as a big help, more work was done with a hex editor. Hats off to Jasper for fixing a few minor TraceWrangler bugs which I encountered while preparing this posting
That’s a really good example of a real-life troubleshooting exercise.
Explained very clearly too. Thank you.
Did you notice that, when .2 is the client (the connections that work) that the .2 to .1 packets have TTLs that drop from 128 to 119 but on the way back (.1 to .2) they start at 128 and drop to 118.
Asymmetric routing perhaps?
Good catch!
The asymmetric routing is another point, that is certainly worth investigating.
A very good well written useful article. Thank You.
Comment:
The “Server Hello” is packet 28 instead of packet 29 in Server.view.pcap.
Also, it is 5928 byte length instead of 5929