DDoS Tracefile for SharkFest Europe 2021
SharkFest Europe has opened it’s doors for the pre-conference classes. Presentations will start on June, 17th.
I am honored to give a presentation on DDoS attacks. The trace files for the presentation are available for download at http://www.packet-foo.com/blog/SF21EU/DDoS_Tracefiles.zip
The Zip file contains five traces:
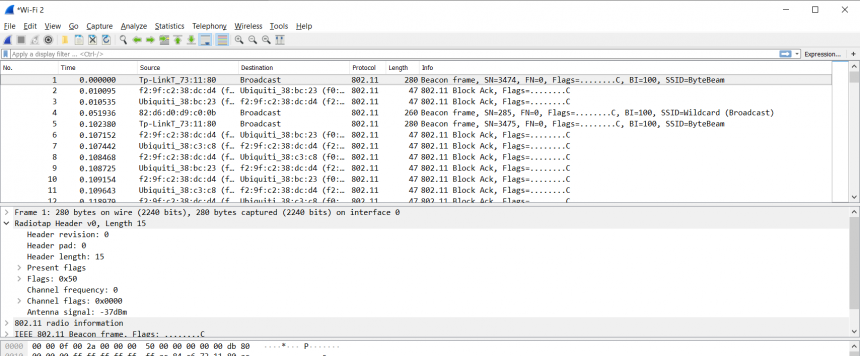
FreakOut_Flooding.pcapng
Shows the UDP Flood, TCP Flood, SYN Flood and Slowloris attacks implemented in the FreakOut bot. While an analysis published by Checkpoint covers many technical aspects of the bot, we will examine the traffic you would see as a victim of the botnet.
Each attack wave starts with a syslog message that describes the upcoming attacks. The syslog messages have been added to aid in the analysis of the trace files.
FreakOut_Reflections.pcapng
Shows UDP based reflection attacks. Compare the MAC addresses of the sender and receiver to verify, that source and destination
hosts are different.
Each attack wave starts with a syslog message that describes the upcoming attacks. Again, the syslog messages have been added to aid in the analysis of the trace files.
SYNflood.pcapng
Traffic from a generic SYN flood attack, not related to FreakOut.
UDPreflection.pcapng
Traffic from a UDP reflection attack, also not related to FreakOut.
UDPreflection_trigger.pcapng
A single DNS request that was likely used to trigger the DNS responses found in the trace file UDPreflection.pcapng
Useful Display Filters
Here are the most important display filters, if you want to click along during the presentation. You can use copy & paste to avoid any typos.
The filters are listed in order of appearance
UDPflood.pcapng
udp or icmp
(ip.flags.mf == 1 or ip.frag_offset > 0)

(ip.flags.mf == 1 or ip.frag_offset > 0) and ip.dst == 198.51.100.165
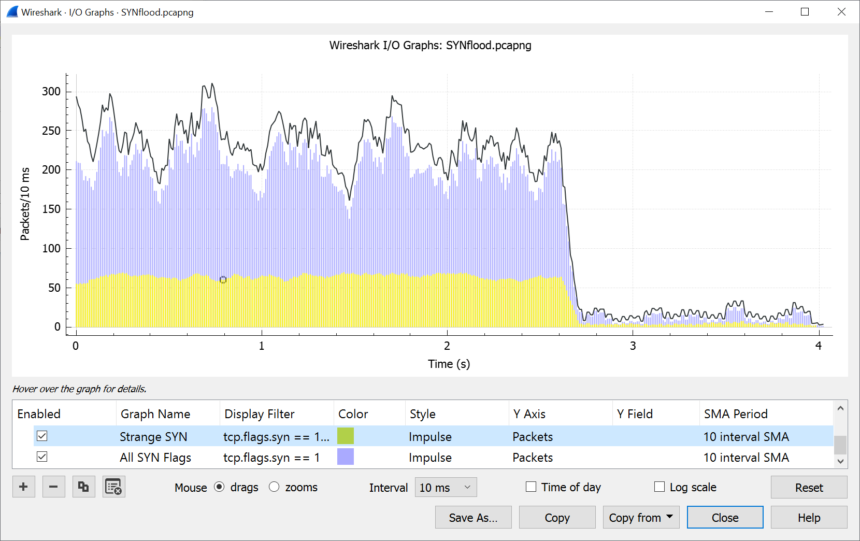
SYNflood.pcapng
tcp.flags.syn == 1 and tcp.flags.ack == 0 and ip.dst == 100.64.0.0/16
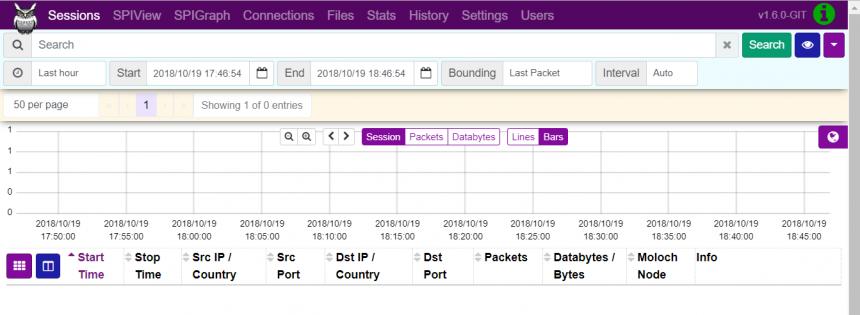
Preparing the I/O Graph
Using Wireshark we will create an I/O Graph similar to this one.

Here is how to prepare the graph:
- Note that we select the unit “Packets” for the Y-Axis.
- Select two distinct colors for two graphs.
- Select “Impulse” style.
- Use the 10 interval SMA period to smoothen the graph.
- Finally, set the interval to 10 msec.
Hope to see you all at SharkFest!


Recent Comments