Wireshark Column Setup Deepdive

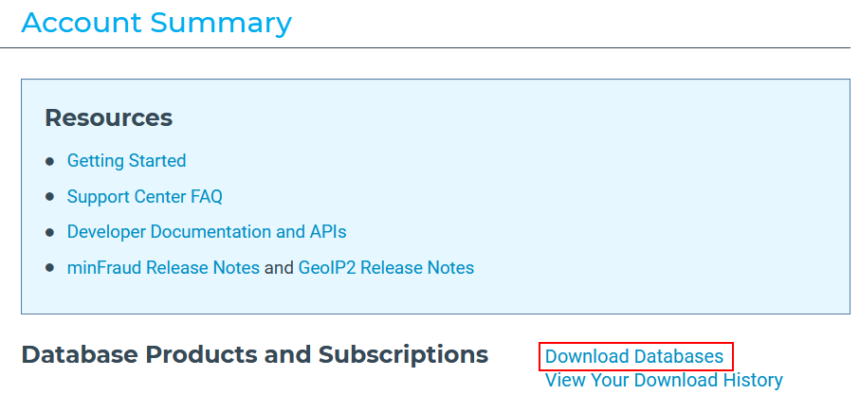
Every once in a while I check the blog statistics for the searches that have brought visitors here. Most of them are more or less concealed versions of “how can I grab the password of others/my ex partner/my children/friends”, which comes as no surprise. Today I saw one search expression that I used as inspiration for this post: “Good Wireshark columns to have”. So let’s talk about them.

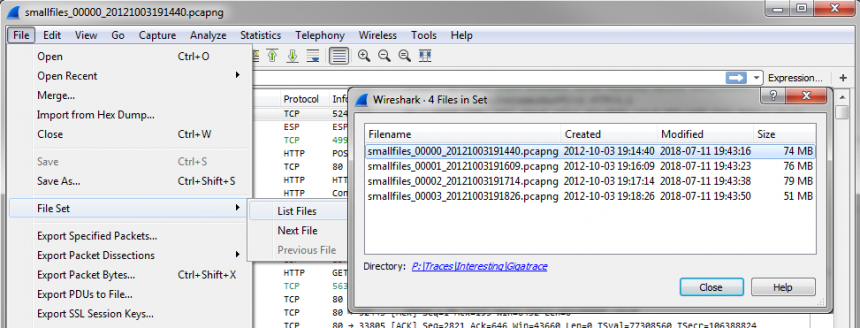
PCAP Split and Merge

Sometimes it also happens during network troubleshooting engagements, but it is also common for analysis jobs regarding network forensics: dealing with huge number of packets, sometimes millions or more. Two typical situations may have you scratch your head: either you have one huge file containing all packets at once, or you have a ton of small files that you need to look at. So let’s see how we can still tackle both.

The Network Capture Playbook Part 6 – Planning Network Troubleshooting

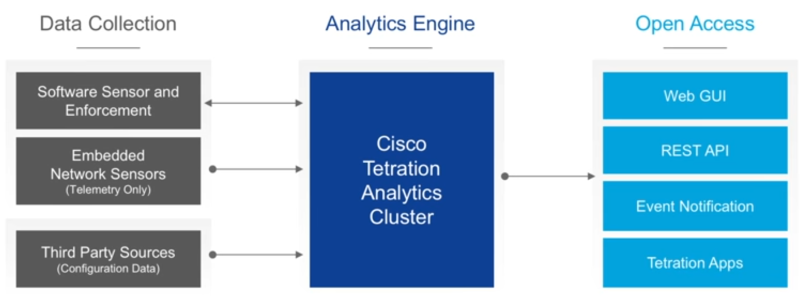
In the previous posts of the Capture Playbook series we discussed various approaches about how to record packets, but before going into more elaborate techniques of doing that we should talk about how a network troubleshooting project works, and especially how to plan a capture setup. In my experience this aspect of a troubleshooting is often neglected, which can be lead to problems during analysis. In the worst case scenario, a botched capture setup can make it impossible to find root cause in the packets that were collected.

Sharkfest 2017 US Recap – 10 years of Sharkfest!

Time always flies at Sharkfest, the annual Wireshark conference, and the 2017 edition – being the 10th Sharkfest in the US – has been no exception. On Friday Sake and me talked about how fast the 3 day conference had felt and we both agreed that “hm, it seems just to have started moments ago and it’s already time to go back home”. I don’t know about you, but for me and him that’s a sure sign of a good conference. Not a single boring moment.

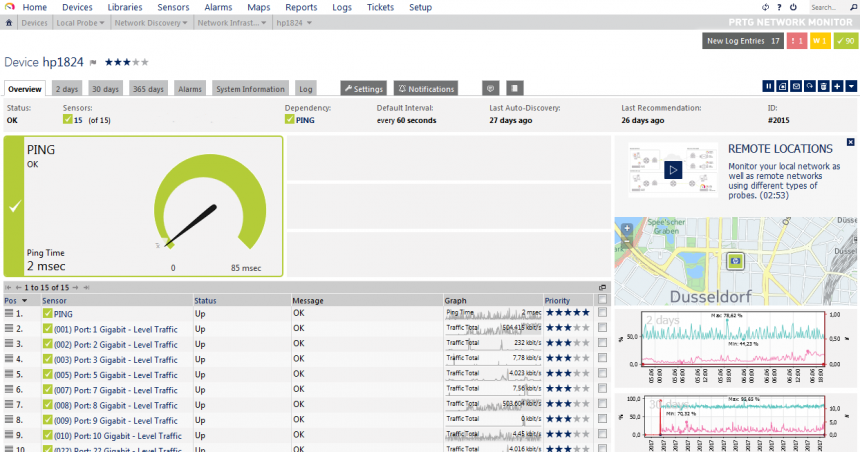
A look at Paessler PRTG

During Tech Field Day Extra at Cisco Live Europe 2017 one of the presentations we attended was from Paessler, about their PRTG monitoring tool. I had only seen it once before, during a penetration test I performed at a customer site – and since it was running with default credentials it gave a very nice insight into the IT setup they had. But so far all my monitoring I had setup myself had been via Nagios or Icinga. So after the presentation I wanted to check out PRTG myself and installed a test version. After letting it run for a while I had seen enough to write a blog post about it.