A look at Paessler PRTG
During Tech Field Day Extra at Cisco Live Europe 2017 one of the presentations we attended was from Paessler, about their PRTG monitoring tool. I had only seen it once before, during a penetration test I performed at a customer site – and since it was running with default credentials it gave a very nice insight into the IT setup they had. But so far all my monitoring I had setup myself had been via Nagios or Icinga. So after the presentation I wanted to check out PRTG myself and installed a test version. After letting it run for a while I had seen enough to write a blog post about it.
Let’s look at the main differences between a Nagios/Icinga installation and a PRTG installation first:
- The PRTG core runs on Windows OS only, meaning you may need to buy an OS license, too, unless you’ve got plenty already
- Setup of sensors for PRTG is done via web browser, not text based config files
- Nagios/Icinga are free/open source, while PRTG costs money (at least unless you run the free “100 sensors” version)
Installation
PRTG runs on the Windows platform only, which means that right now some of my readers are probably mumbling something like “Windows? Gotta run Linux…”. Well, everything has advantages and disadvantages, and of course Windows has the main disadvantage of costing money for the OS license (yeah, and it’s closed source, I know). But on the other hand it’s easy to use, especially if your administrators are used to working with Windows boxes anyway – which isn’t that uncommon for small and medium sized businesses, which is the main customer base PRTG aims at. Having installed Nagios and Icinga myself a few times I have to say that installing PRTG is much easier – run the installer, click through the install options, done. No “apt-get”, “yum” or “dpkg -i” for all the things you need, or compiling from source. Which is all good and fine, don’t get me wrong – but it needs way more background knowledge about how things work in detail compared to a installer just doing all the necessary tasks for you. And if you want statistics collection you need to prepare a database first, which can be a challenge if you’ve never done it before.
The first step of the installer is to require an email address, and that’s quite important – because that email address will receive notifications and alerts from the PRTG installation later:
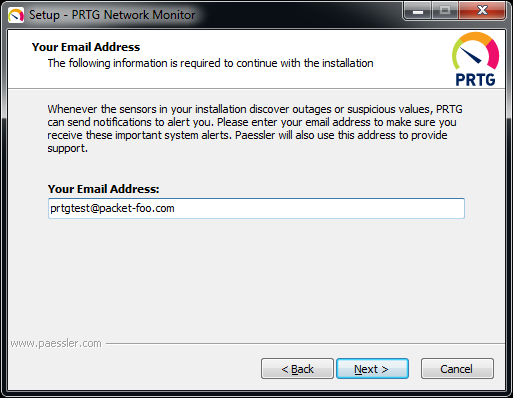
Figure 1 – PRTG Installer Support Email
The email notifications are a good thing, of course – but during my tests I had to say that some of them are a bit annoying at times as well, because the PRTG installation will not only send you alerts, but also a lot of tips about how to setup PRTG. But for administrators less experienced with device monitoring they are probably quite helpful, so I won’t moan too much about the “tips SPAM” (and it gets much less frequent really fast – I haven’t received one in a while now) 🙂
Next, it wants a license, which you’ll get on the download page (without the very common annoying registration forms to bypass, first):
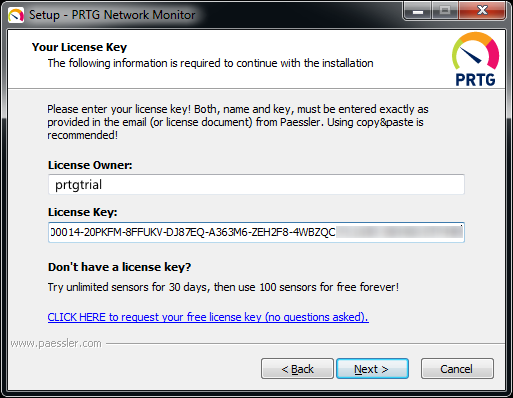
Figure 2 – PRTG Installer License
The interesting thing with the license is that you can run 100 sensors for free, which is a nice offer to get started. For a company that’s probably not going to do the trick, because 100 sensors aren’t that much if you have more than a handful of devices you want to monitor. I also like the “no questions asked” hint, because way too many vendors keep making their test installs so annoying (with forms to fill out about why you even dare to try the product, follow up emails every few days etc.) that it isn’t fun to start a test.
When all is done, a web browser takes you to the login page. The default login is “prtgadmin” with password “prtgadmin”, and it is very very very important to change that as a first thing. The reason for that is that PRTG is a goldmine for hackers if they can get in, because it tells them a lot about the infrastructure of their target, and has interesting fields with usernames as well (for the device credentials; passwords are “dotted out”). After that, you’ll see the status page, and a first scan is performed:
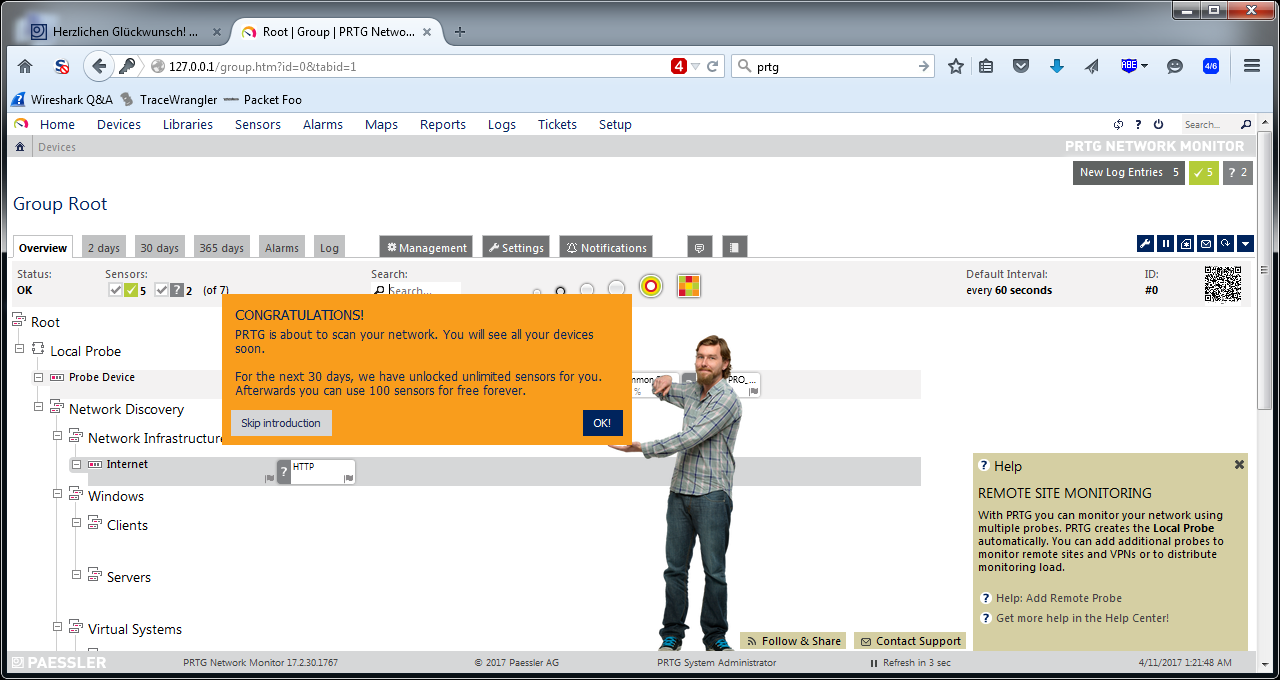
Figure 3 – PRTG Initial Scan
When the scan is finished, the first couple of sensors will show up, and PRTG will ask you for credentials to be able to scan more thoroughly:

Figure 4 – PRTG Scan Credentials
You can see that PRTG monitors the system it runs on (called “Probe Device”), and also adds a check for the availability of the “Internet” (by running a HTTP sensor on “www.google.com”) as well as your DNS and gateway. Every one of those green/yellow/red boxes is a “sensor”, and counts for the license.
Sensor setup
The big advantage of PRTG from my point of view is the sensor setup. A sensor is a check that is performed on a system, e.g. CPU load, memory load, disk loads (multiple disks of a single system can be checked while counting as just one sensor), and many more. So if you decide to add a sensor to a device you want to monitor there are a ton of predefined checks ready to go:
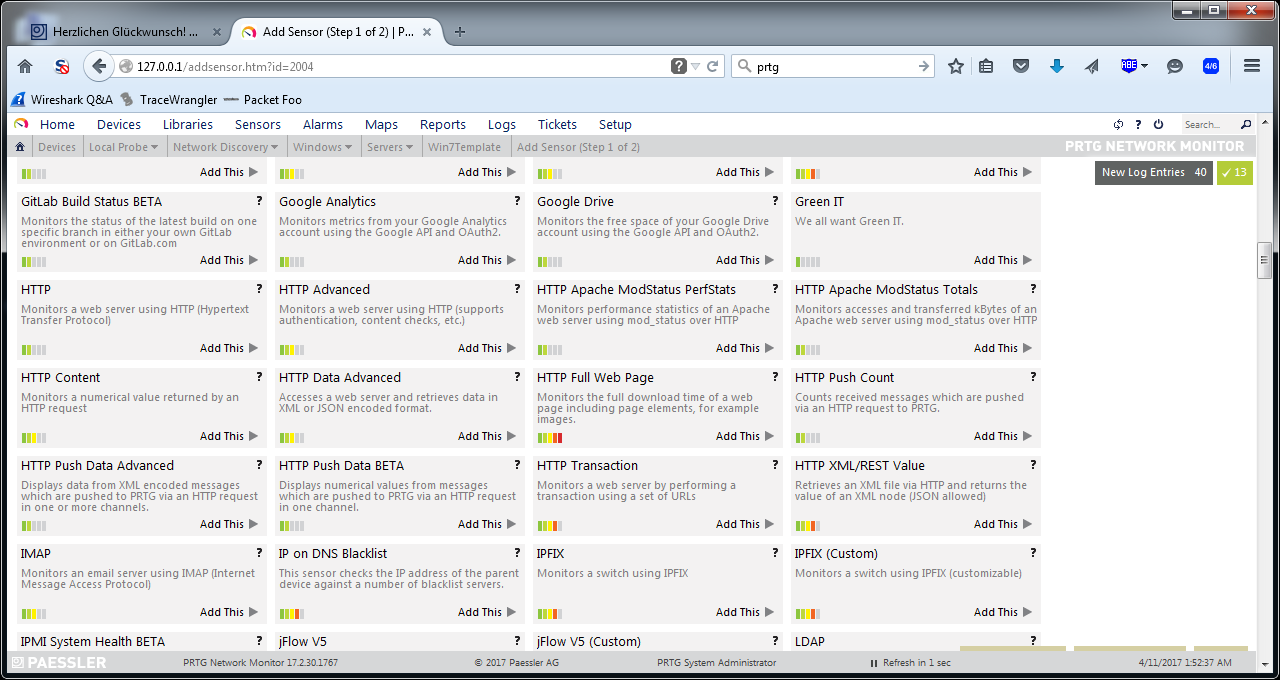
Figure 5 – PRTG Sensor List (partial)
And that’s one of the coolest things about PRTG – you don’t need to write scripts, or fight with config file parameters to add a sensor. In most situations it’s enough to provide credentials to allow the sensor to read the system values, and you’re done.
Monitoring things like the IPMI health status is a breeze, or adding all the VMs on an ESXi hypervisor (though I recommend doing that on the vCenter if you have one, because otherwise monitoring fails when a VM is moved across the cluster members by DRS). Using WMI you can check services on Windows platforms and define if they should be restarted automatically if they’re stopped. And if the predefined sensors aren’t good enough you can build your own or head over to the PRTG script world to find more.
Statistics from the start
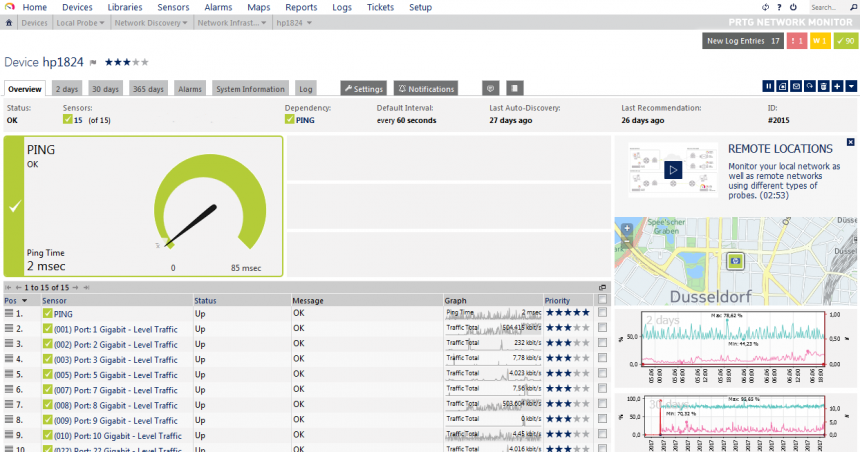
Another thing I liked about PRTG is that all sensors are automatically gathering statistics and displaying them in nice little graphs, e.g. for one of my Gigabit switches:
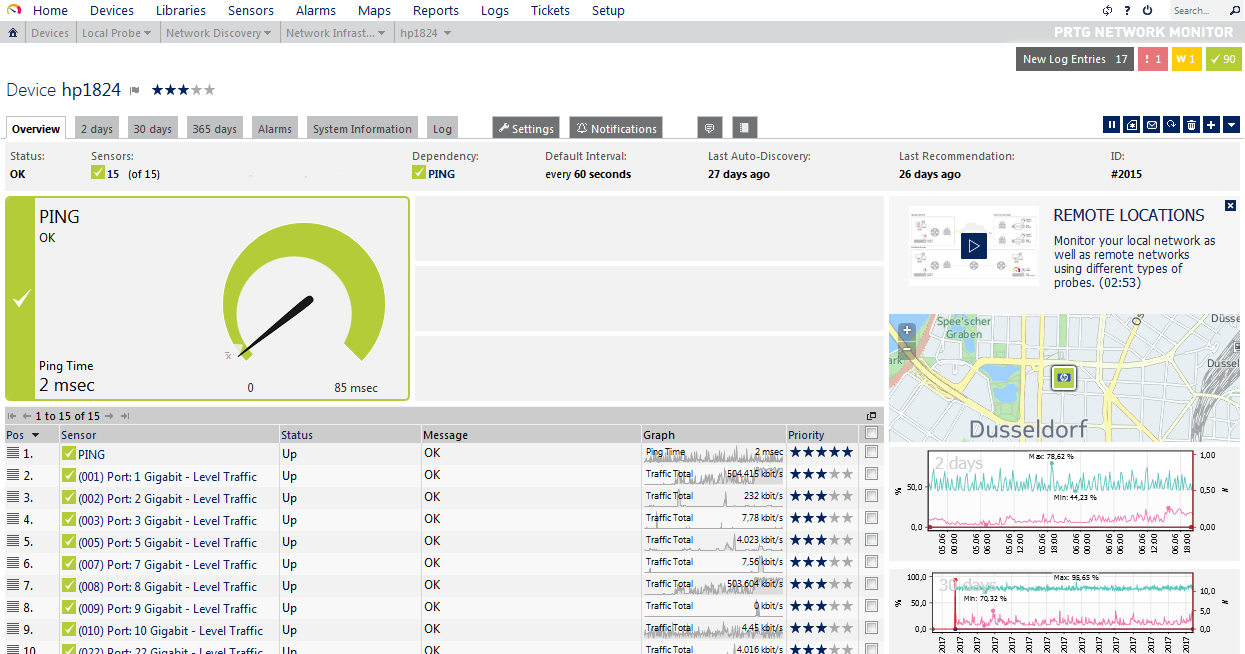
Figure 6 – PRTG Statistics
The nice thing about the statistics collection is that PRTG will use the available data sets to perform anomaly detection. So it’s not just monitoring that a switch port is up, but will also create a notification if the port sends or receives an unusual amount of data for a comparable period of time:

Figure 7 – Alert for unusual amount of traffic
There’s no need for the administrator to configure a database for the statistics manually – it’s all done during setup.
The Google Analytics problem
During my tests I noticed that my Firefox showed a blocked script for the PRTG status page. This surprised me, because I had whitelisted all my internal IPs and loopback addresses. Which means I had to check out what was going on. And it was this:
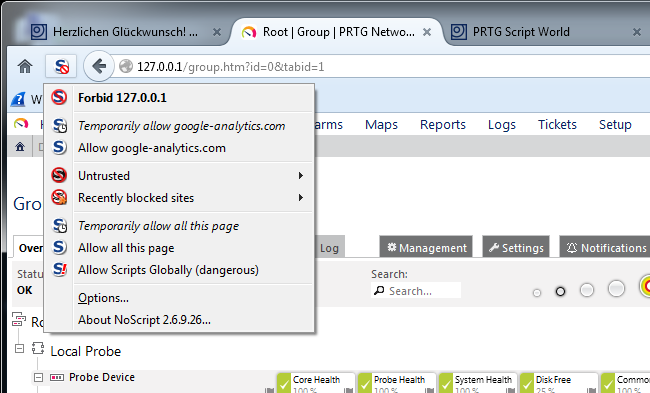
Figure 8 – PRTG NoScript Warning
Now, I don’t know about you, but I will never allow Google Analytics to run scripts in my browser, which is why I had the blocked script warning. I wondered what that script could be good for on a web site that is by definition “internal only” from a security point of view. A monitoring system should only be available from within the network, never from outside – I even have been on customer sites where they even hang the TFT monitors on the wall in a way that no visitor can ever catch a glimpse of the current status. Which may be also caused by the fact that there seems to be no serious monitoring going on anywhere that hasn’t at least one red warning somewhere 🙂
Anyway, I opened the source code of the page to check what the script was about. Which doesn’t seem to work right away, because PRTG implements it’s own right-click menu – but the simple trick is to put “view-source:” in front of the URL, and you’re done. The first thing was that I had to laugh (not about the script, but the comment on top – well played, Paessler 🙂 ):
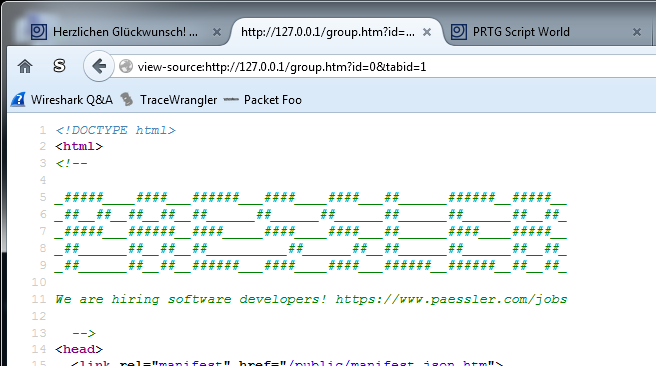
Figure 9 – PRTG Source Code Hint
Scrolling down, I found the Analytics script:

Figure 10 – PRTG Source Code Analytics Script
Now, from what I can tell the idea for this script is probably to track trial installations. So when I enabled the script to see what happens if it’s allowed to run, I caught this GET request, which included the Windows device name, screen resolution, and some other IDs:

Figure 11 – PRTG Analytics Script GET Request
Now, that’s something I definitely do not want to be sent to the Internet, especially not to Google Analytics and in clear text. Because even if you’re less paranoid than I am – here’s what you can find if you google for the Analytics unique ID Paessler uses (UA-154425):
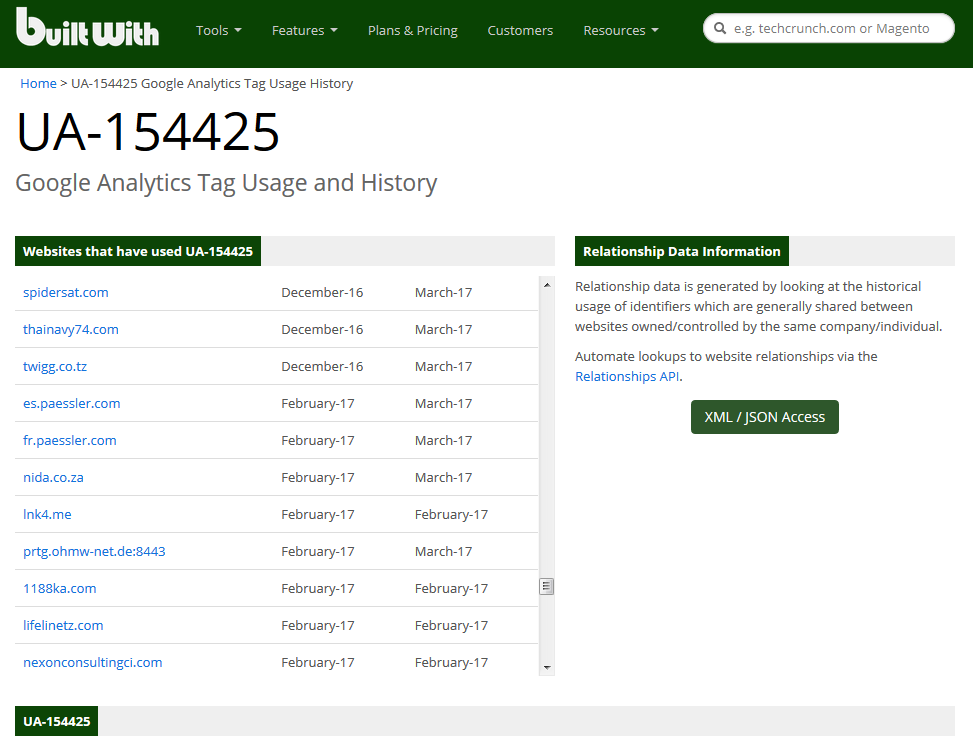
Figure 12 – Google Analytics Tag Search
That’s a problem right there, because now everyone can see you’re running a PRTG installation – and in some cases they’re accessible from the Internet (I checked), with only a login prompt protecting the goods. I can hear someone say “it’s fine, nobody will ever find this. We’re using the totally unexpected TCP port 8443 for this”. Remember, people: security by obscurity fails. every. single. time. And considering the sensitive nature of information inside the PRTG installation (IPs, URLs, Login credentials for WMI/SNMP/virtual environments/switches/routers etc.) a lot of bad guys may be interested and dedicated enough to run their password testing scripts as long as it takes. Of course the exposure of PRTG to the internet is not the fault of the vendor, because it’s the customer who made the mistake – but I guess many of them do not realize that the Analytics script leaks that kind of information about their installation.
So I contacted Paessler about this issue and they told me that the Analytics is only used during trial to improve PRTG and user experience. As soon as a customer buys a license, Google Analytics is disabled automatically (I couldn’t check because that would mean I’d have to buy a license on my own just for that). Other than that, they highly recommend not to put PRTG in a location where it is reachable from the internet, and I can only agree. PRTG does have a password brute force protection, but you should not rely on that functionality if you can prevent public access at all. If you need to access a tool like that remotely, do it via VPN (running an OpenVPN server via pfSense is really not that complicated). Paessler has a few knowledge base articles to setup reverse proxies for PRTG in a situation like this, but I’d always go for a VPN instead.
Final words
PRTG is a nice alternative to Nagios, Icinga and all the others out there. For a small company that doesn’t have time and money to train their admins to setup monitoring with open source tools it is probably a lot cheaper to use the commercial PRTG version. The learning curve is much easier, and basic monitoring can be setup with skills any admin should already have. The amount of predefined sensors is impressive, offering simple as well as complex checks at the click of a mouse. So in the end Nagios and Icinga may be free, but the learning/having the necessary skill to set it up isn’t – and PRTG may turn out to be the cheaper solution in some situations. I’ll run a free 100 sensor installation for my devices from now on, as it requires less of my time compared to adjusting my existing Icinga installation every now and then.
Disclosure
This post is a part of my Tech Field Day post series. I was invited to this event by Gestalt IT. Gestalt IT covered travel, accommodation and food during the event duration. I did not receive any compensation for participation in this event, and I am also not obliged to blog or produce any kind of content.
Any tweets, blog articles or any other form of content I may produce are the exclusive product of my interest in technology and my will to share information with my industry peers. I will commit to share only my own point of view and analysis of the products and technologies I will be seeing/listening about during this event.
Cool article!
I often use PRTG too. Trial version is very good for monitoring IP video surveillance systems: we can arrange sensors to monitor SMB video-fileserver availability and also some custom status-related webpages of our IP cams.
Also I like configurable alert system – you can easily got PRTG to send you emails, push messages and so on based on counters, good/bad status etc. It’s a very flexible system.
PRTG also has mobile Android client (probably iOS too, I didn’t check for it). So you are able to receive alerts just instantly on your phone.
Thanks, Vladimir! And yes, I tested the Android app as well, which is nice to have as an alert device.
Interesting, we are one of Paessler partner and only get to know the section on the Google Analytics part after reading your post. Never know they would have use that to keep track on trial account.
Also another recommended option is to setup a SSL HTTPS on any PRTG installation so that your credentials when login on to the web interface is encrypted.
Yes, I fully agree, going for HTTPS is the way to go.
Fun fact: I looked up PRTG on Shodan and sure enough there are some network monitors accessible on the internet. Not terribly surprising considering so many things are these days. BTW Jasper, I saw you at Sharkfest this last week, enjoyed your talk!
Thanks, Dan, glad you liked it!
Thumbs up!
Absolutely PRTG one of the best Network Monitoring tools i’ve used!
Nagios, Cacti and others have a unlimited sensors but the installation it self take a really long time but they also have the Virtual Machine option where you can drop it on the host and just open the Web-interface at http://vm-hostname/cacti for example,
But with PRTG i had only minutes to start monitoring Cisco Switches for troubleshooting through SNMP,
PRTG is the one for small scale networks or monitoring Server machines!
100 mails first 15 min.. very difficult to remove account.
Very pushy software !!
Think before you install
Yes, the flood of mails is a little too much (even though I can’t remember it being 100 mails 🙂 ) – but at least for me it all went across my own mail servers so I could live with it.