Trace File Case Files: SMB2 Performance
We had an interesting question regarding SMB2 performance on the Wireshark Q&A forum recently. Upon request the person asking the question was able to add a couple of trace files (=”capture” files). The question and a link to the traces can be found here:
https://ask.wireshark.org/questions/55972/slow-writes-even-slower-reads-spanning-wan-to-netapp
Since the question nicely fits into the scope my talk on Sharkfest Europe last week I have asked the attendees to take a look at the question. For the next days the number of views increased significantly. So, here are my 2 cents.
First Trace – Writing to the Filer
The file being analyzed is C_to_H_200MB.pcap. We find one really interesting TCP connection on source port 63726. The RTT from the 3-way-handshake is 23 msec. The client side shows a TTL of 128, the server side shows a TTL of 55. So we can assume, that the trace shows the client view of things.
When analyzing slow SMB or SMB2 connections it is often advisable to investigate transactions that occur often or cause a long total time, as specified in the column Sum SRT:
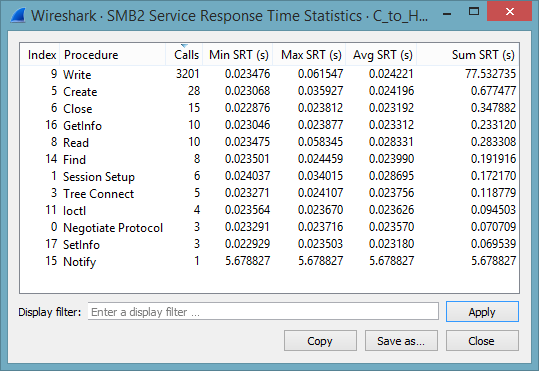
SMB2 Response Time Statistics at sender side
The total time was lost in a number of write operations. This is hardly surprising, as the test cases involves the update of a file. Note that the Write operation peaks at 61 msec. Using the I/O-Graph we can visualize the throughput. Note that the throughput is increasing in a linear way to 200 MBit/sec.
At the first glance this is rather odd, as TCP usually increases the transmission rate in a logarithmic way. We will discuss this little fact at the very end of this post.
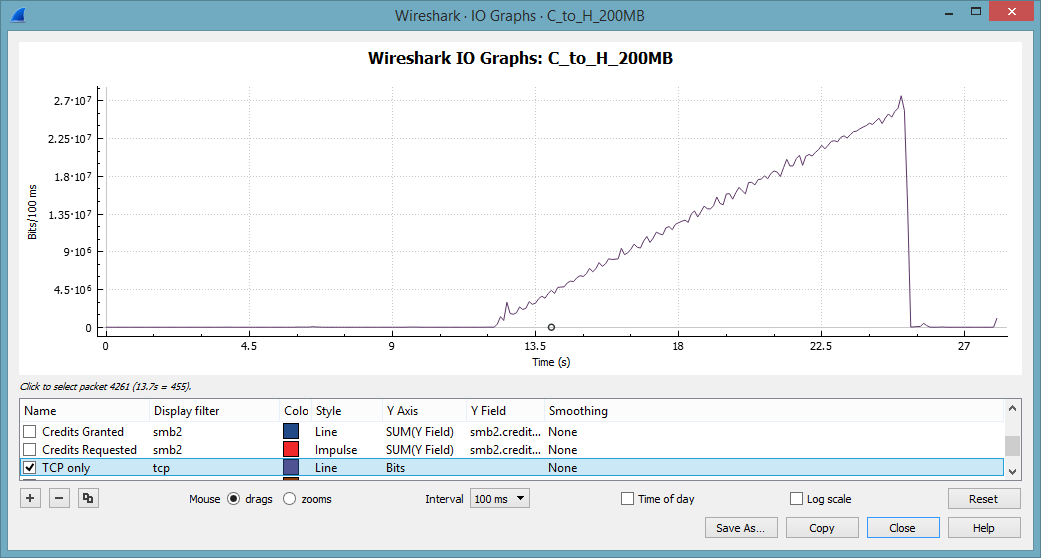
I/O Graph at sender side
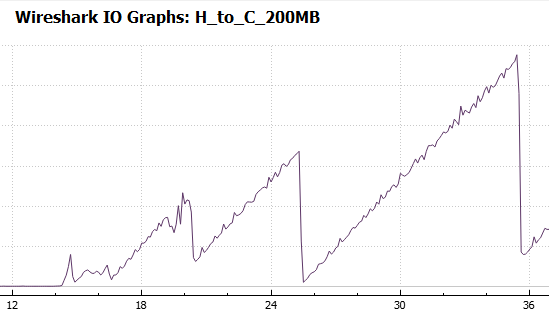
Second Trace – Reading from the Netapp Filer
This file is H_to_C_200MB.pcap. The interesting part is one large TCP connection with the source port 63753. Again, we find a RTT of 23 msec. The service response time shows a maximum SRT of 2.5 seconds for read operations. This is clearly a very long time.
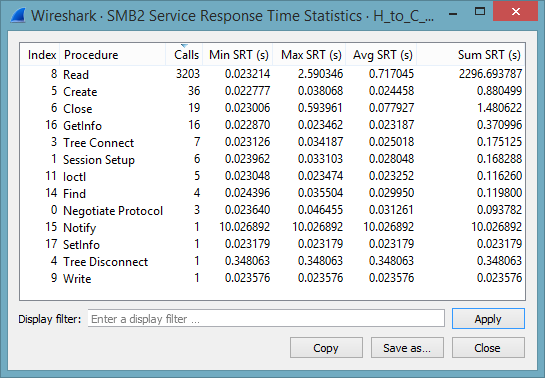
SMB2 Response Time Statistics at receiver side
SMB2 uses a concept of credits. Clients receive a number of credits when the session starts. Each I/O will cost a number of credits, depending on the I/O size. The server will grant credits with the response code. One credit will allow up to 64 kByte. Larger request sizes cost more. As long as the client has sufficient credits he can pipeline multiple requests. If the server is experiencing a heavy load, credits will be replenished slowly or not at all. Luckily we can visualize the use of credits with Wireshark’s wonderful IO Graph:
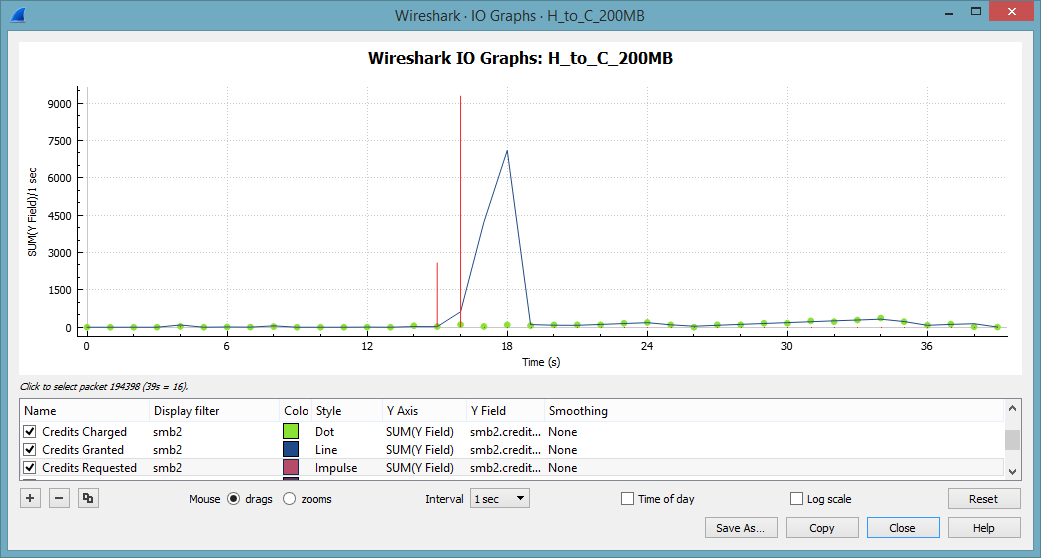
I/O Graph at receiver side
15 seconds into the trace file the client starts requesting credits like mad. These requests are granted a few seconds later. As the server is still granting a healthy dose of credits we can eliminate an overloaded server for the time being.
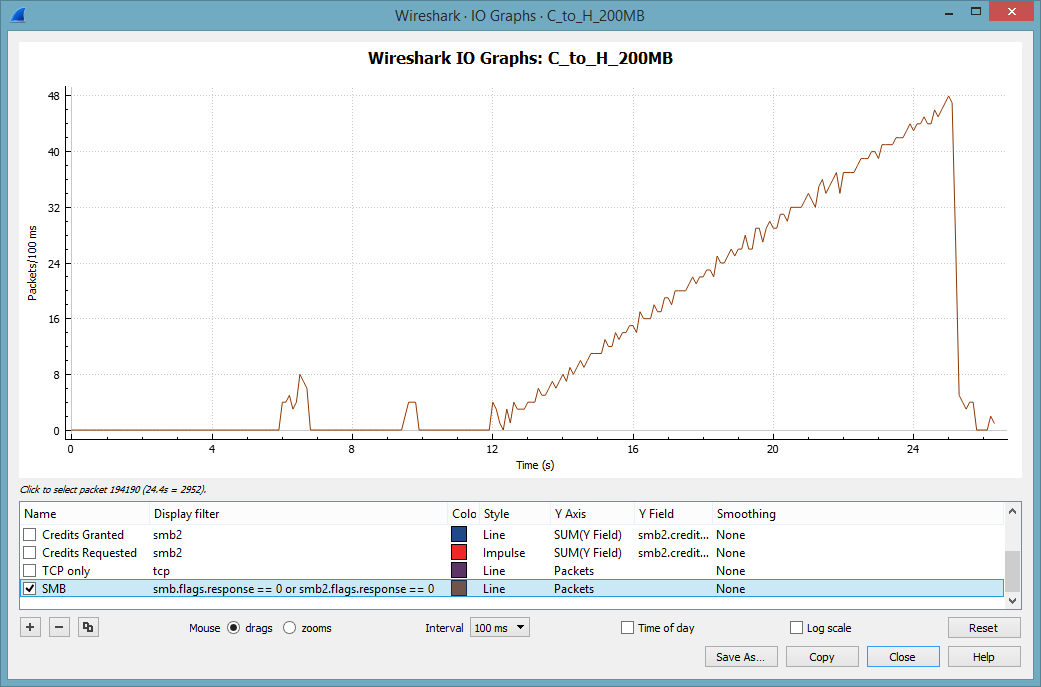
Way more interesting is the TCP throughput. This tell-tale pattern becomes clearly visible if we set the interval for the Y-Axis to 100 msec:
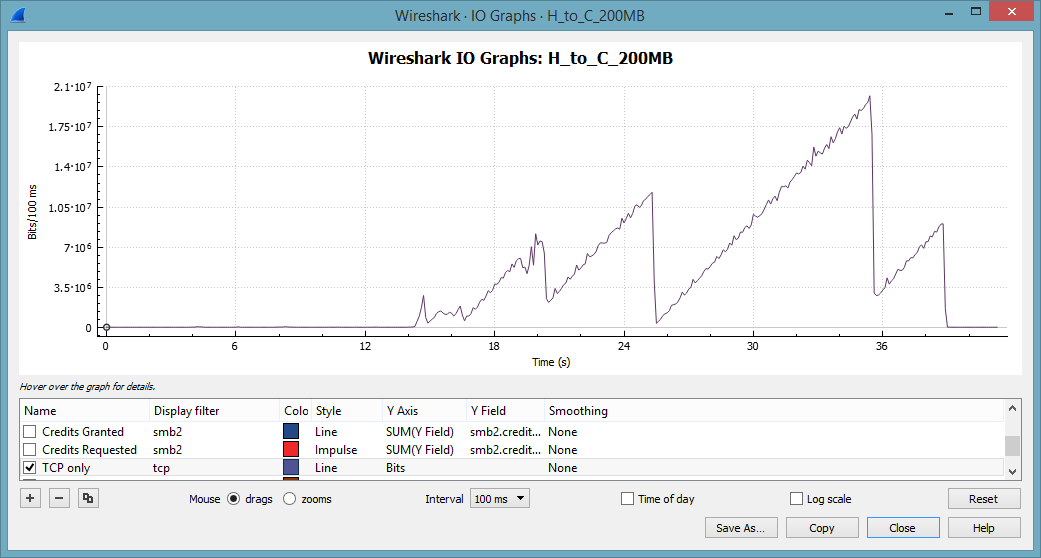
SMB2 I/O Graph at receiver side
This saw-tooth pattern is a text book example of multiple TCP slow starts. Note that we never reach the same throughput as with the write operation. Wireshark makes it easy to spot retransmissions and lost packets. Unfortunately, we don’t have many of these. Instead the TCP expert delivers a number of interesting and rather odd expert messages:
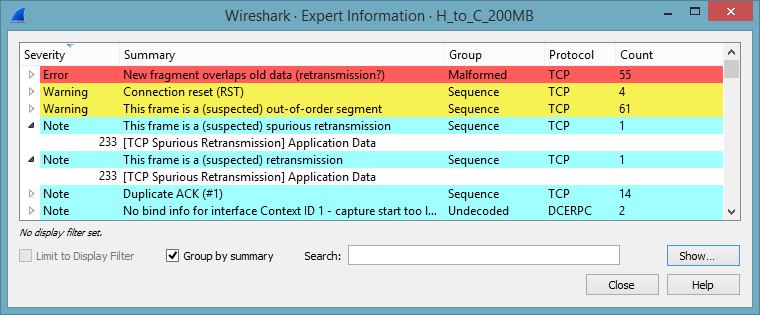
SMB2 Expert Info
Most remarkably we have overlapping data. This is worth investigating. Here is one small section where it happens. Note the (relative) sequence number 488433 in packet 734:
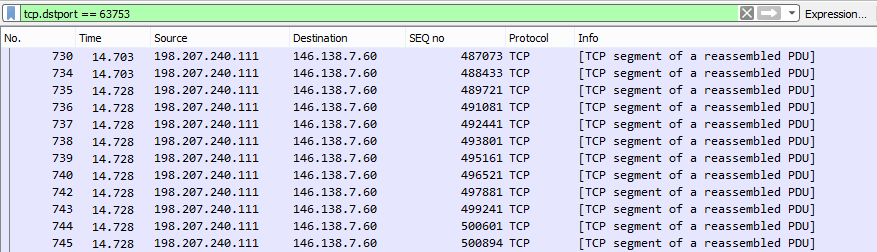
SMB2 packet list excerpt 1
We get the same data again in packet 824. This time the packet sizes are slightly different, as data is sent en block from the buffer:
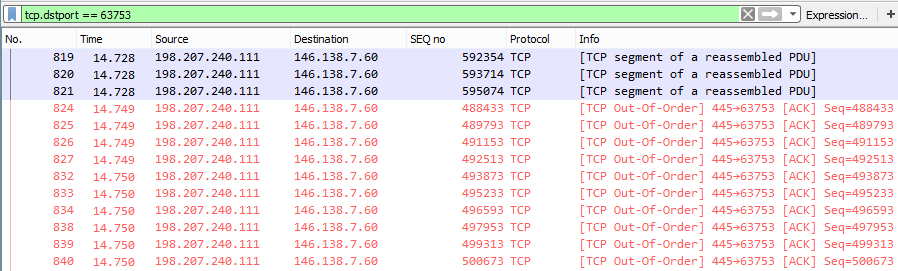
SMB2 packet list exerpt 2
Our client is dutifully acknowledging data. The server must have missed a rather large number of ACKs to undergo a TCP slow start. This packet loss is definitely not caused by the client side.
Summary of Findings
- Using Wireshark’s service response time (SRT) function we can confirm a very long response time from the file server.
- We see a TCP throughput that matches the pattern of massive packet losses and TCP slow starts.
- Our client trace does not show packet loss.
- The server retransmits data, despite the fact that we send our retransmissions.
- We can conclude, that more than one ACK from the client was lost.
- The lost ACKs were not a single event, but occurred multiple times.
Possible reasons
The packet loss could be caused by a number of events. Examples are:
- Duplex mismatch
- A change in the network topology (Layer 2 or 3)
- Misconfigured teaming on the server side
- Electrical charges from nearby electric devices (elevator motor, forklift trucks, nearby train stations)
The question on ask.wireshark.org tells us that the slow performance is quite common and can be reproduced. As the problem only manifests itself in SMB or SMB2 traffic we eliminate these reasons.
Next steps
In situations like that it is often useful to locate similar symptoms in various support forums.
The Cisco support forum shows an entry with similar conditions:
https://supportforums.cisco.com/discussion/11418091/nexus-7010-intermittently-dropping-packets-certain-srcdst-ip
The article links to a known bug for the Nexus 7000:
https://quickview.cloudapps.cisco.com/quickview/bug/CSCtg95381
Before pointing the finger at the Nexus it would be advisable to verify, if the conditions given in the bug report are met in this special configuration. We don’t have the information about the server at this time. To locate the real culprit requires an analysis of the whole chain between the Client and the Netapp. Under the given circumstances I would work my way from the server backwards, starting with the link between Nexus and Palo Alto.
Epilogue: The tale of the linear throughput increase
I hope that this rather lengthy post still leaves you with a small receive buffer to discuss the last noteworthy topic from this trace: The TCP throughput graph. You might remember the throughput from the first trace file:
I/O Graph: Taken at Sender side
To explain this behavior we have to remind ourselves that we are not investigating one lengthy data transfer, as in FTP. FTP would send the file en block in one TCP turn. This is SMB2, where the file is requested in chunks of 64 kByte. In other words: The client can control the bandwidth used for the transfer by timing the requests.
The relationship between TCP throughput and SMB2 requests becomes evident when we visualize the number of SMB Requests:
Looks familiar, eh?
Great article.
Do you know why the client sends at the end more requests than at the beginning?
I am not sure why the client is behaving this way. The client has received 31 credits at the beginning of the session and the server kept on handing out credits for each service.
If there is something inside the MS-documentation I didn’t find it.
There are slim chances that is caused by a QoS Policy: Using a group policy, the bandwidth used by clients and servers can be limited. As this is rarely used, and the policy is probably not recognized by the NetApp.
Hi Eddi,
thanks for the answer.
Could the default parameter DisableBandwitdthThrottling=0 has sommething to do with it, or does it work in a totally different way?
Hi Eddi,
Thanks for the article!
Does SMB2 have some built-in congestion control using L7? (Not server congestion, but network one).
And could you please tell me where have you got an information that the problem only affects SMB file transfer? I’ve seen that Christian asked for the test with FTP or SCP, but his question got no answer.
The original Ask.Wireshark post contained samples of 200MB transfers as well as 1GB transfers, done from two different office locations and with similar but different underlying causes of the slowness.
This blog article is focussed on the 200MB transfers, so this comment will also focus on those.
This is a complex problem and to properly understand what is going on, we need to understand:
– TCP “Transmit Window”, “packets in flight” or “CWND”.
– TCP “Slow Start” exponential throughput ramp up – versus,
– TCP “Congestion Avoidance” behaviour (when congestion is detected, halve the transmit window then ramp up linearly).
– TCP Selective Acknowledgements (SACKs).
– TCP Duplicate SACKs (D-SACKs).
– Cisco ASA Firewall behaviour (the ASA handles packet losses itself, effectively hiding them from the downstream side).
This problem is addressed in a set of 4 articles on http://www.lovemytool.com. The first 2 articles are already there and the following 2 articles will be published approximately a month apart.
Those articles have been written by Bob Brownell, the developer of the analysis tool, NetData, that I also used to determine the cause of the “slowness” in these trace files.
http://www.lovemytool.com/blog/2016/12/slow-writes-slower-reads-by-bob-brownell.html
http://www.lovemytool.com/blog/2017/02/cisco-asa-behaviour-with-packet-losses-and-overtaking-using-netdata-visibility-by-bob-brownell.html
Those articles contain detailed charts that visually display the behaviours involved. Therefore, I’ll just provide a summary of the relevant observations here.
The original Ask.Wireshark post #55972 contains this network “diagram”:
Win7 workstation -> LAN -> ASA -> Cisco ASR -> DMVPN -> ASR -> Palo Alto -> Nexus -> NetApp
Note that the PC where the captures were taken is on the left hand side and we have an ASA firewall on the local side of the DMVPN WAN. Thus, any packet losses or OOO packets that occur on the other side of that ASA are hidden from us. We have to infer them from the received SACKs, redundant retransmissions and the timing of those events.
Findings – Both Directions:
1) The underlying cause of the throughput reductions are out-of-order packets (OOO) on the other side of the local ASA firewall. That is, somewhere between the local ASA firewall and NetApp.
Win7 workstation -> LAN -> ASA -> Cisco ASR -> DMVPN -> ASR -> Palo Alto -> Nexus -> NetApp
||
2) Very early in each transfer, during the “Slow Start” ramp up, OOO packets and their respective SACKs or Dup-ACKs generated from the receiver cause the sender to enter “Congestion Avoidance” mode. This involves halving the transmit window (often multiple times) and then ramping up linearly (just one extra packet is added per round trip). This is the underlying cause of the “sawtooth” throughput patterns.
3) The minimum round trip time (RTT) between the PC and NetApp is 22.9 ms.
4) All SMB requests are handled in blocks of 64 KB.
Observations (C-to-H):
a) We are sending the data, so we see the data packets leave the PC in the correct order.
b) The slow start ramps up to 102 packets in flight after just 8 round trips. Just for interest, the server’s Receive Window is 300 KB at this point.
c) However, we then receive SACKs from the NetApp (starting with packet #608).
d) These SACKs indicate that data packets #499 to #572 were not received but #573 to #606 were.
e) Based on the SACKs, our PC begins to retransmit that large data block, as #615 to #736.
f) Just 1.2 ms after the first SACK, we receive normal ACKs acknowledging the whole original block of 102 packets.
g) Given the RTT of 23 ms, those ACKs can only mean that the original block of 102 was eventually received intact. The SACKs tell us that #499 to #572 must have been overtaken so that #573 to #606 arrived at the NetApp before them. Packets #499 to #572 probably arrived at the NetApp just 1.2 ms late.
h) Due to the apparent (but we know not real) large packet loss, the PC halved its transmit window so that only 54 packets are sent in the next burst (#609, #614, #737-#791). Halving packets per round trip is halving the data throughput.
i) Interestingly, we receive several Dup-ACKs indicating that #609 was not received so we retransmit it as #801.
j) Just 2 ms later, we receive normal ACKs for all 54 packets. Again, we can infer OOO at the receiving NetApp.
k) This additional “packet loss” triggers a further halving of the PC’s transmit window. Just 25 packets (#838 to #862) are transmitted in the next burst.
l) Since we’re now in “Congestion Avoidance” mode, subsequent packet bursts increase by only one packet per round trip. We see 26, 27, 28, … packets per round trip eventually ramping all the way up to 539. We remain in “Congestion Avoidance” mode for the rest of the file transfer, never seeing “Slow Start” again. This is why we observe the linear throughput increase until the end.
m) As the TCP data throughput ramps up, the PC is able to include more and more 64 KB SMB blocks in each TCP round trip. Thus, the PC increases its concurrent SMB write requests to fill the available throughput.
m) 539 packets is around 730 KB, so the final round trip delivers data for 12 SMB blocks (at 64 KB each) in the final burst.
n) Just out of interest, the server keeps stepping up its Receive Window so that it is always approximately double what we are transmitting.
Observations (H-to-C):
A) We are receiving the data, so the activity on the sender side of the local Cisco ASA firewall is hidden from us.
B) The ASA receives packets out-of-order on the other side, sends its own SACKs back to the NetApp then buffers packets until “gaps” are filled. Only when it has packets in the correct order does it release them to us.
C) The server’s slow start ramps up to 79 packets (107 KB, #735 to #821) in flight after 13 round trips. Just for interest, the client’s Receive Window is 1 MB at this point in time.
D) The PC transmits ACKs for all those data packets but then receives 24 unnecessary retransmissions (#824 to #870) in about 1 ms less than the minimum RTT. These are non-contiguous and represent just 24 of the 79 packets in the previous “burst”.
E) 2.2 ms after the first retransmission, we receive the next full “burst” of data packets – which is now halved to 39 packets (#872 to #914).
F) From the “C-to-H” trace, we know that the OOO occurs on the other side of the local ASA firewall. From the retransmissions and their timing, we can infer that the first 21 packets of the burst of 79 arrived at the other side of our local ASA out-of-order and later than the others in the burst.
G) We infer that the ASA sent SACKs back to the NetApp, informing it that the first 21 (and 3 more non-contiguous packets) were not received.
H) However, once the local ASA received the 24 late packets (which were only about 1 ms late) it released the full original burst of 79 packets to us in the correct order.
I) The NetApp responded to the ASA’s SACKs by retransmitting the 21 + 3 “missing” packets. The ASA then passed those retransmitted packets straight through – which we observe in the trace as unnecessary retransmissions.
J) When the NetApp received our PC’s ACKs for the full burst of 79 packets, it ceased retransmitting and sent the next normal burst. However, since it had detected “packet loss” it halved its transmit window so that this burst was just 39 packets and is now in “Congestion Avoidance” mode.
I) Our PC transmitted D-SACKs (#828-#831, #835-#837, #843-847, #855-861, #865-867, #869, #871) in response to all 24 unnecessary retransmitted data packets (#824 to #870).
J) The NetApp interpreted those D-SACKs as normal Dup-ACKs and retransmitted yet another unnecessary packet (#916). Due to these further apparent packet losses, it further halved its transmit window to just 19 packets in the next burst.
K) Being in “Congestion Avoidance” mode, the NetApp increases its subsequent bursts by just one packet per round trip and we observe the following round trips delivering bursts of 20, 21, 22 and 23 packets.
L) The OOO behaviour as in (D)-(J) above re-occurs, resulting in the NetApp’s transmit window halving twice to 11 then 6.
M) The NetApp now ramps up to 7, 8, 9 … 35 (47 KB) when another instance of retransmissions occurs, halving the transmit window to 18 packets.
N) It only ramps up to 32 before we get yet another halving, then again a linear ramp up to 37.
O) Packet #3221 is another unnecessary retransmission at the start of another two halvings, taking us back down to 10.
P) We get a fairly good run from there, ramping up to 167 packets (226 KB) per round trip (around 70 Mb/s).
Q) A similar set of OOO events reduces the transmit window down to 41 packets (55 KB).
R) At the best point in the flow, we manage to achieve 424 packets (575 KB) per round trip (about 160 Mb/s) before being knocked back down to 52 packets (halving three times). The first unnecessary retransmission here is packet #172758.
The several “sawtooth” changes in the observed throughput are all due to the same type of “Out-Of-Order” behaviour on the other side of the local ASA firewall.
As well as the Cisco ASA firewall “misleading” us by hiding the OOO activity, the large 2.5 second SRTs reported by Wireshark during the read test are also somewhat misleading. They are not a symptom of any server problem at all. They are a symptom of the way the client requests the data from the server. This can be a story for another day.
Disregard my question…figured it out….not used to entering smb2.* into the I/O graph. Soon as I did…DAH! I’m wondering how I never heard of the SMB2 Credit concept before…got some due diligence ahead of me…Thanks R/Fritz
So what was the cause of the OOO packets?
The packets were getting out of order somewhere in the MPLS WAN network (not controlled by the original poster).
At least after this, he knew to stop blaming NetApp and begin a conversation with the WAN provider.