
Megalodon challenge solution
During Sharkfest 2015 I put up a challenge that was different from the usual challenges offered. The pcap files are a lot bigger, the task to solve less specific, and the answer not a simple “easy to verify” answer. I promised to put up my solution a few months after posting the challenge to this blog, but then some things got in the way. And then… some more got in the way. Sorry for that, but sometimes it can’t be helped.
Quite a number of people have taken the challenge in the meantime, and I have to say I received a number of impressive reports going into much greater detail that I did myself on the original analysis job. Of course I had less time to get my results back then, as the customer was going to go live with the application a few days later.
Basics
The Megalodon challenge holds a couple of interesting aspects that I wanted participants to experience. First of all, the files I posted are larger than what most people normally look at, so working on them is a challenge on its own. I sanitized the files of course, using TraceWrangler, so no real IP addresses or real application data can be found in the trace files, but the timings and the TCP behavior is still original. Filtering on big files takes time, and finding the real problem is not as easy as when you’re looking just at one small TCP conversation. I received numerous emails with questions and comments from participants, and so I could tell where they got stuck or on the wrong track. So let’s check a few aspects on how to tackle the Megalodon challenge.
Spoiler Alert: If you want to take the challenge, do not continue to read!
We need Focus
This is something me and Landi preach all the time: focus on the problem. Try to not get distracted. And actually, this is exactly what happened to almost all participants at one point or another. If you look at the challenge details you’ll notice that the problem reported by the customer was specifically about the communication problems between the Windows servers with the IP addresses 192.168.1.1 and 10.0.0.10. So when I worked on the original capture files I completely focused on all TCP conversations between those two IPs only.
The problem: most participants spent a lot of time and energy looking at the conversations between 172.28.190.238 and 192.168.1.1. This is understandable, because those two IPs exchange a lot of data as well:
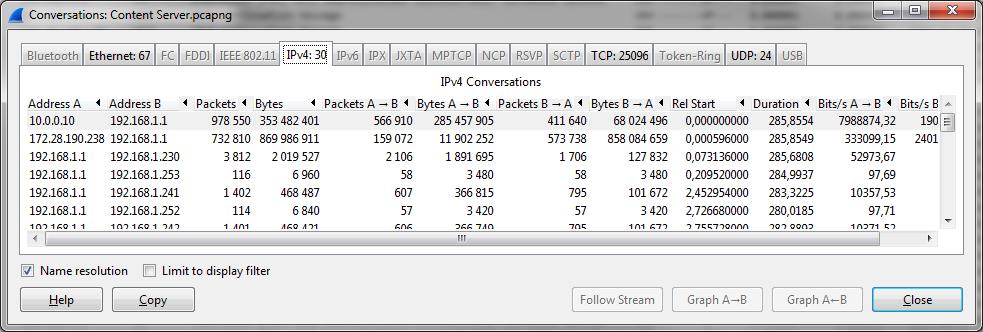
While it may be interesting to see what those two are doing, it isn’t directly related to the problem description. Sure, one of the problem IPs is involved, but that’s not good enough to spend time on those conversations at the start. And, I have to admit, I just left them in the shared trace files for two reasons: distract participants, and make the files bigger (and harder to work on). Mean, I know. But that’s what happens in the real world, too.
So what did I do in the original analysis? As I already said, I kept my focus on everything happening between 10.0.0.10 and 192.168.1.1 – which most of the challenge takers probably had to realize when my answers to questions about 172.28.190.238 was something like “no idea, didn’t look at those at all”. So what I did was this:
- Verify if the capture files contain packets that match the problem description
- Examine if I can find the reason for the problem to happen
- look at other conversations if I need to
As you can see, looking at 172.28.190.238 would be part of the last entry of my list, and I never actually got there. Anyway, the first two tasks are often time consuming, but let’s see how to solve them.
Verifying the problem
This part is very important. You can spend hours reading PCAPs in vain if you are looking for something that can’t be found at all. During capture you should already verify if you see packets from the IP addresses you expect, so when you start the analysis you already know that those are in the files. But you still need to check if you can spot indicators of the problem, because otherwise the PCAPs may not be good enough.
The problem description can be reduced to the following sentence: “At a certain point in time during the test there would be unanswered page requests […]” – so we have to verify if there are TCP connections that show signs of failure. Okay… and how can we do that?
A few things come to mind:
- Check if the TCP conversation behavior (handshake, retransmissions, timings etc.)
- Check if the application protocol shows signs of trouble, e.g. HTTP errors codes etc.
Since the application protocol is non-plaintext and proprietary (meaning: Wireshark doesn’t decode it at all), filtering for signs of trouble there is not a real option, at least not in the beginning. Sometimes it can’t be helped and you need to work with unknown protocols, basically reverse engineering parts of it, or doing differential analysis.
So let’s check TCP behavior first – which means, we start by trying to find TCP handshake problems to see if we can spot problems establishing a session. To do that we look at the capture on the client side (the Web Application Server), where we can be sure that the outgoing SYN packets are seen. We open up “Web Application Server.pcapng” from the challenge capture files, which contains 2,669,351 packets. That’s a bit too much for efficient manual inspection, but we don’t have to go that far. I hope.
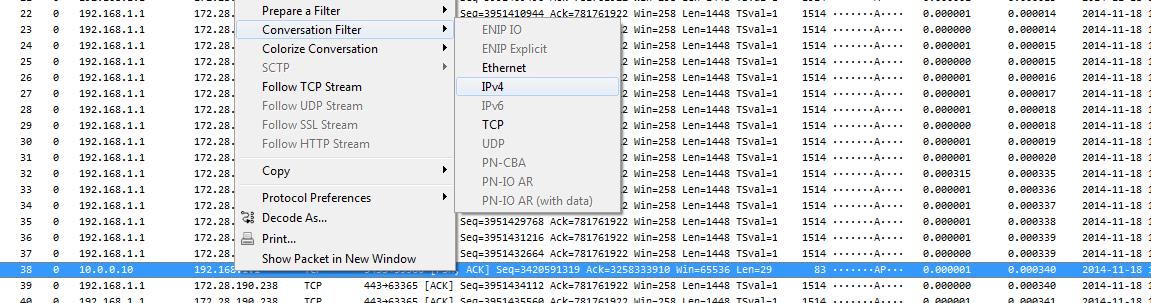
Instead we go for the TCP conversation statistics in Wireshark to get our bearings, but before I that I do something else: filter on the two IP addresses I need to look at, and then export the filtered results to a new file. That way I only have to work with the packets I really need, and loading/filtering times are much faster. My standard way of doing that is to create a sub folder of the current trace working directory called “filtered” and save the extracted packets there (using a good filename that tells me what was filtered and why). That way I always know that they were not original captures but something I extracted with a filter. The fastest way to isolate everything between the two IPs is using the popup menu to filter in Wireshark on the IPv4 conversations:
The capture file containing all packets between the two problem IPs has 1,496,099 packets, which is a lot better than before. Opening the conversation statistics shows that there are 36,952 TCP conversations, so let’s find the ones that may show a problem with the connection handshake.
As a reminder, an unsuccessful TCP handshake is either:
- SYN – RST (rejected open port on the server)
- SYN – RST (firewalled, rejecting packets)
- SYN… (firewalled, dropping packets)
Generally, a successful TCP connection has at least 3 handshake packets, plus usually some data exchange, plus teardown packets (FIN-ACK FIN-ACK, or with an RST). For a full connection we should see at least 4 packets.
So, to find unsuccessful connection I focus on conversations with 6 packets or less, because that is most likely giving me those where the SYN wasn’t answered or refused. The Windows TCP stack retries it’s SYN packets three times (even when receiving RSTs), so we see 3 packets when there is no SYN/ACK coming back, and if the SYN is refused we get 6 packets (SYN-RST three times). And if we sort the TCP conversation statistics by the “Packets” column we see a lot of conversations with 3 packets, and can easily filter on one of them:

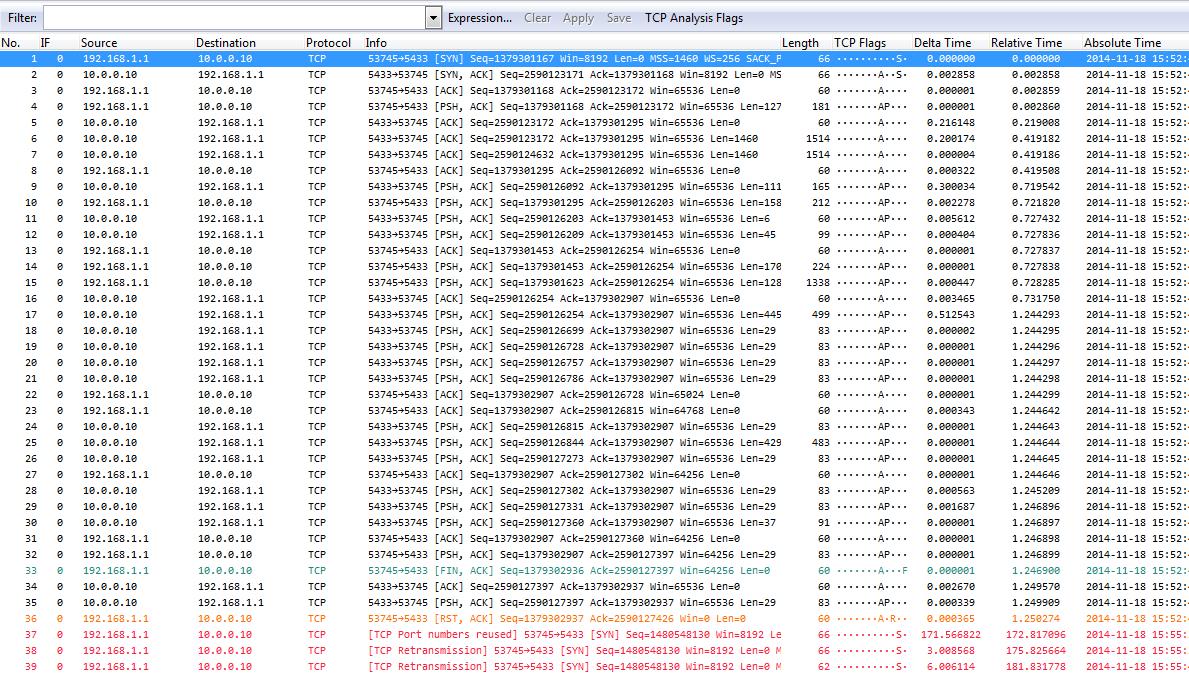
The resulting conversations are very interesting:
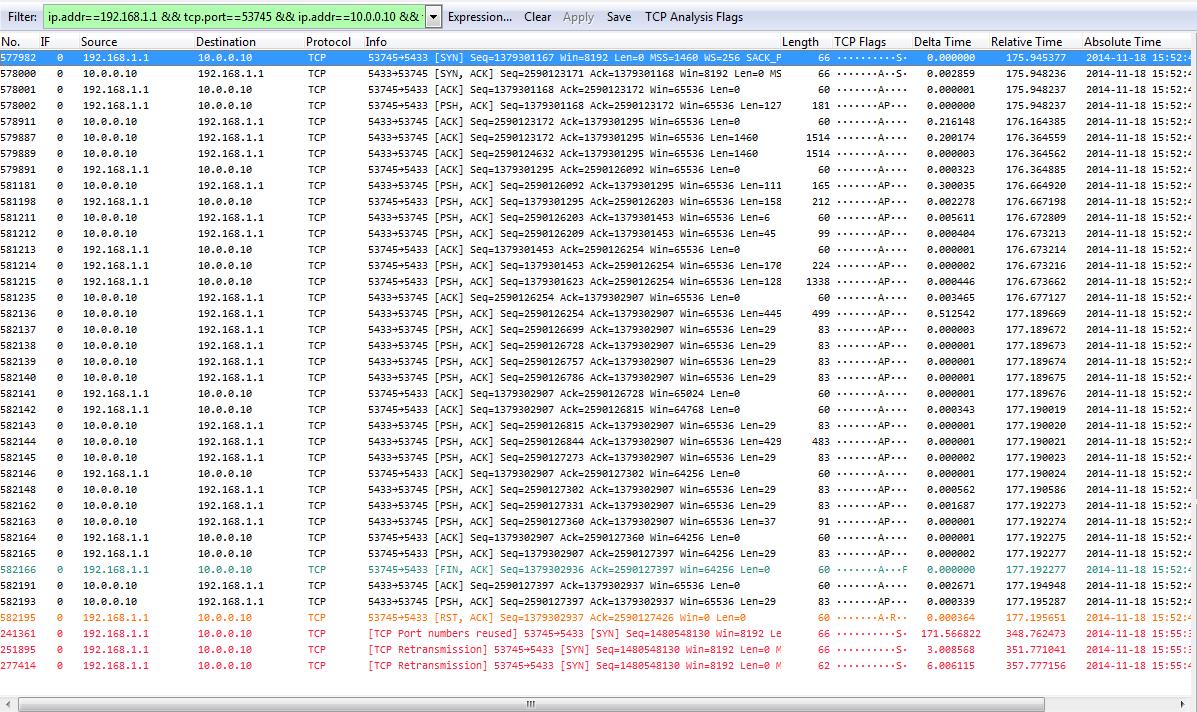
We have a couple of things we can tell right away from this filtered conversation – apart from the screenshot showing the red lines at the end apparently having a lower packet number than the previous packets. But that’s just because I didn’t resize the packet column width before taking the screenshot – the real packet numbers at the bottom are 1,241,361 and later, with the leading 1 being cut off (I didn’t retake the screenshot on purpose 😉 ).
There are at least four things of interest:
- The conversation statistic showed 3 packets, but when we filtered we got 39 instead
- We see a working conversation that is finished with a FIN/ACK – RST combination
- Wireshark says “Port numbers reused” next
- The three SYNs (including the one saying “Port numbers reused”) of the new connection are unanswered
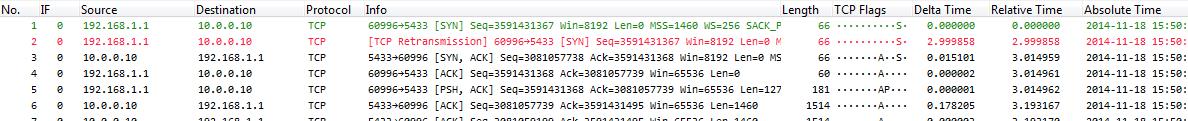
Now, we can work through all four points, but there’s something more important to do first. Remember that we have captures taken directly at the client (the Web Application Server) as well as the server (the Content server). To exclude the network as a source for the problem we need to check if we see the same problem on the content server trace. Which is actually really easy: we copy the conversation filter from the filter box to the clipboard, and start a new Wireshark instance. Then we load the content server trace with a read filter we paste into the according edit field, like this:
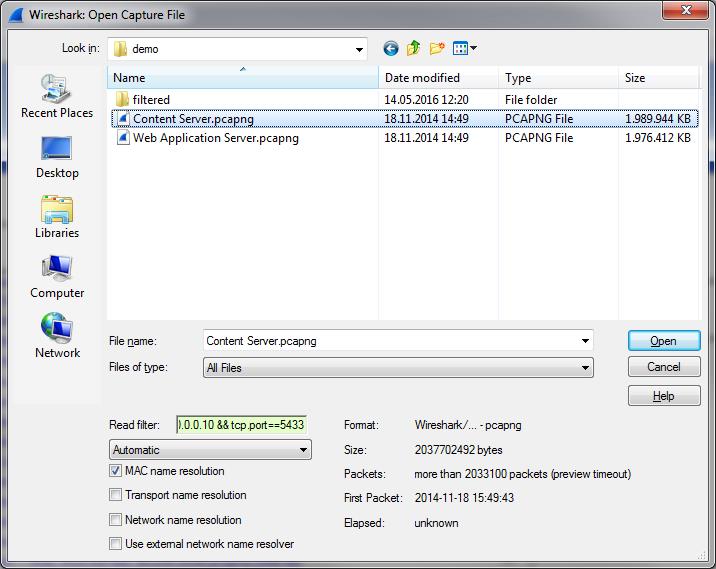
The read filter makes Wireshark compare each packet from the file with the conversation filter and only load packets that are a match. That way we will end up with a pretty small file we can quickly check:
As you can see, the capture only contains the packets matching the filter. If we compare them to the web application trace we can see that the timings are slightly different, but only for some packets and as little as can be expected from a Gigabit+ LAN setup. Other than that it’s easy to see both sides are identical – so we have no problem caused by the network, at least not for this conversation. In the actual analysis situation I checked multiple conversations to make sure this wasn’t just a coincidence, but it turned out that every connection I checked showed the same result. Which means that our problem is not caused by the network. This is good, because it automatically means one other thing: we can ignore the second trace and just work on one of them instead of having to compare packets between them.
The four findings
Okay, back to our four findings:
- We get 39 packets after filtering, not three
- We see a working conversation that is finished with a FIN/ACK – RST combination
- Wireshark says “Port numbers reused”
- The three SYNs (including the one saying “Port numbers reused”) of the new connection are unanswered
Finding 1: 39 packets, not 3
This is actually easy to explain: when Wireshark filtered on the conversation statistic row it did that by building a 5-tuple filter. Since the new session reuses the same source port it has an identical 5-tuple as the previous connection. Which means that both conversations match the filter. Which, in our case, was a good thing because we found something interesting.
Finding 2: FIN/ACK – RST
This finding is not really something we need to spend much time on – while connections used to be terminated by sending a FIN/ACK FIN/ACK pair (client and server each sending a FIN flag and then getting it acknowledged by the other node), things have changed. It is now quite normal to see a connection being “killed” with an RST flag. The RST flag has the advantage of being faster and freeing up stack resources instantly, because the connection state is immediately removed from the according tables. Okay, so no problem here.
Finding 3: Port numbers reused
The Wireshark TCP expert says that port numbers are reused, which is clearly true. We have one successful connection followed by an unsuccessful one, both using the same client port. Many participants thought that this must be the problem, and they had a point. When a client connects to a server it chooses an ephemeral port, with a port range depending on the operating system and stack. As soon as it has used the highest possible port number it starts with the lowest number again. Which means that if a client is opening large number of connections in a short amount of time you’ll see port numbers being reused (simply because it has to).
The stress test that was performed while the captures were taken generated such a high number of connections that it is no surprise to see port numbers being reused. This doesn’t happen quite this often with normal clients, so you usually do not see it this much. Now the question really is: do the reused port numbers hurt or not?
According to RFC1122, a TCP connection terminated by FIN/ACK FIN/ACK must linger in TIME_WAIT state for 2x MSL (Maximum Segment Lifetime). MSL is usually 2 minutes, so the TCP has to wait 4 minutes before it can reuse the port. If we check the delta time between the last packet of the old connection and the first SYN of the new connection we see about 171 seconds, which is less than 4 minutes. This would mean we have a problem, but there’s one simple reason why we don’t: the final packet of the first connection is a reset packet. This means that the connection doesn’t use TIME_WAIT at all, but it dropped instantly – the port could be reused almost immediately without a problem, and most certainly after 171 seconds. So to sum it all up: no, reusing the port is not the problem.
Finding 4: unanswered SYNs
The SYN packets after the first successful connection are not answered at all, neither by a SYN/ACK nor a RST packet. This is very unusual, because that can only happen when a firewall silently drops the SYN packet. And since we already verified that we see the SYNs on the server side as well we know for sure that there is no firewall between the two IPs. Keep in mind that the trace files were both taken with professional full duplex TAPs connecting directly to the network card of the client and the server, so there is nothing between each of the capture points and the devices except for a 2m CAT6 cable.
Many participants got in trouble at this point, sending me tons of questions about this behavior, including
- maybe the RST is lost on the way to the server, so it is still in TIME_WAIT (no, because we see the RST on the server trace. It could be dropped on the network card of the server, but that’s not very likely)
- maybe SYN-Flood protection is enabled, leading to the server refusing SYNs coming in in high number? (good idea, but no, that setting wasn’t enabled on the servers)
In the end, there’s still only one reason why we don’t get anything back when sending a SYN, and that’s a firewall. Which is odd, because
- there is no firewall device between the client and the server
- we see that the server accepts connections on the port, so any local firewall must be set to allow access to it (and it was)
- if the application crashed (or just the thread holding the handle to the socket) we should get a RST back until it restarted, because that’s what happens when a socket is not firewalled but not in service (which we did not see)
The plot thickens
Before we continue to investigate the SYN problem let’s check if it happens more than once. This is important, because a single failed connection wouldn’t be enough to cause a problem as big as the one the customer experienced. To do that we could filter on more conversations with only 3-6 packets, and check if they have the same problem.
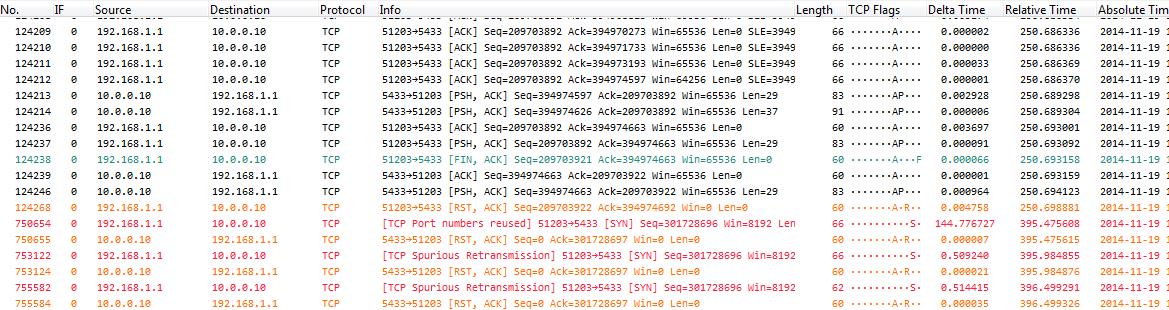
So while filtering through the conversations we find many conversations having problems with their SYN packets not being answered. We can also find other interesting conversations like this one:
Here we can see that the first SYN is completely ignored, but the second suddenly works, 3 seconds later. Again, this looks like the socket wasn’t available, but WHY don’t we see a RST packet?
The answer is: there IS a firewall. Wait. Didn’t I say there’s no firewall? Yes and no. There is no additional firewall between client and server, but the local Windows firewall was turned on. And what many people do not know is that the Windows firewall behaves very differently from what you’d expect:
- When a port is firewalled, it drops incoming packets
- When a port is not firewalled and an application is listening on that port, a SYN/ACK is sent for each SYN
- When a port is not firewalled but there is no application listening on that port, it is treated like a firewalled port – and no packet is sent at all (including no RST)
This behavior is mind-boggling, because most people think a port is either firewalled or not firewalled – but the Windows firewall takes advantage of running on the local system and thus knowing if a port is listened to and protecting it against scans when it isn’t.
Now, the next step should be clear, at least it was for me: I needed to take another capture (on the content server side was enough, because we already know it’s not the network). And that’s exactly what I did – I went to the customer site again the next day and asked them for another test, with the Windows firewall disabled.
For the challenge I also expected the participants to tell me that they would do that next, and I prepared/sanitized a trace without the firewall for anyone who’d ask – but nobody ever did, much to my surprise.
After taking the capture with the Windows firewall turned off, we can find example conversations like this one:
As we can see, now the SYNs are rejected with a RST packet. Which means that the socket wasn’t in service at the time, which also means that the application or thread listening on the port released it. If we check how often this happens we see that in the beginning of the stress test everything works fine, but then more and more SYN packets are rejected. If you filter on enough conversations you’ll see that some connection fail with one RST before they are established, then at some point connections fail with two RSTs before they work, and finally we see three RSTs, which means that they fail completely.
Now this a pretty clear problem of the application, because it should always listen on that port for incoming connections. The exact reason why the port wasn’t in service cannot be solved with network analysis, but needs to be addressed by the server admins and application developers.
Final check
As a final check I used Cascade Pilot (now called “SteelCentral Packet Analyzer”) to draw a graph of TCP flags over time, and used that to verify my assumption. This is what it looks like:
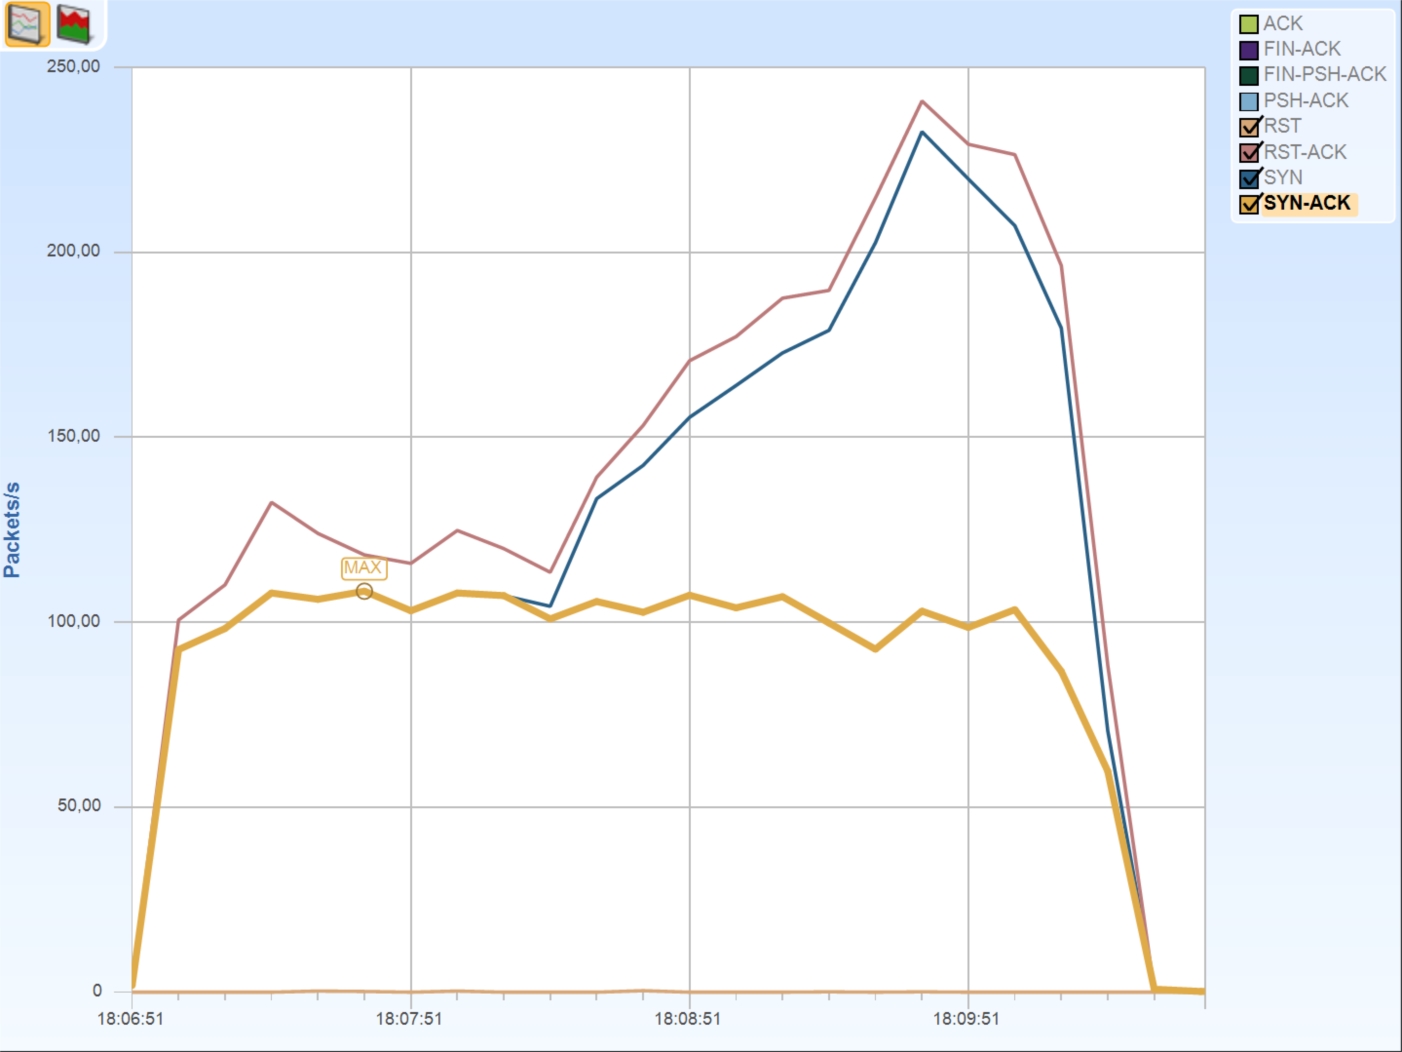
There are always RST packets as we have seen that even the working connections are terminated with a RST packet, but after 1,5 minutes the amount of RST and SYN packets raises dramatically. This is caused by the multiple SYN-RST connection setups failing more and more, while the amount of accepted connection stays at a consistent level. This leads to the assumption that the application just isn’t capable of handling more than 100 connections being established per second.
Solutions
Possible solutions to the problem are:
- Have the application developers optimize it for more concurrent sessions being established
- Add more servers that can be load balanced to handle more overall connections
Lessons learned
- Focus. Focus. Focus.
- Resize the packet column width if necessary
- Port reuse is not always a problem even if it happens faster than 2x MSL
- The Windows Firewall protects closed ports even when a rule allows access
- Do not be afraid to ask to take another capture if the findings require it
Final words
First of all I have to apologize for not answering emails in the end. For multiple reasons I just could not find the time to work through the often very detailed emails to answer in a good way, so I kept pushing it backwards and never got to it in the end. Sorry for that!
Thanks to all participants, especially for being patient with me. Congratulations on all the great questions and reports I received, especially (in alphabetical order):
- Andrea Kleedehn / Stefan
- Christian Reusch
- Jin
- Nathan Flowers
- Philip Storey, who posted his report online
- Thomas Baudelet
- Vladimir Gerasimov
I have to say some of you put way more work into the challenge than I ever expected, and you found details that I never even looked at. I basically tried to get to root cause as fast as I could, and once I had the connection problem isolated I was ready to turn in my report. So it is quite possible I overlooked interesting stuff right left and center 🙂
The total time I spent on this problem was about 16 hours, with initial meetings, gathering information, capture setup, capturing data, analysis, capturing more data, final analysis and creating the customer report. The total amount of hours just for the analysis was somewhere between 2-4 hours.
Thank you Jasper for the solution!
Hi,
Just found your blog today. I’m fascinated by pcap analysis hope to keep coming back.
Thanks Jasper for sharing valuable packet analysis tips,one similar packet analysis article I found,
http://www.packetpain.com/blog/2015/5/13/tcp-sessions-and-firewall-state
Thansk, Kishan – good article, though I always cringe when someone says that the captures were taken on the nodes involved. This can lead to wrong diagnosis results if not careful.