The notorious Wireshark “Out of Memory” problem
It is one of the most common question on the Wireshark Q&A site: “I have xyz gigabyte of memory, but still Wireshark crashes when I try to capture data”, with xyz being a more or less impressive (or even ridiculous) amount of memory. This is how a typical crash looks like (your mileage may vary):
The other thing that may happen is that Wireshark seems to freeze while capturing, which can be caused by very high amounts of packets being received during the capture. Sometimes someone tries tshark instead of Wireshark but still encounters the same problem. I guess I’m not the only one of the guys answering question more frequently at that site that often thinks that “I really need to create a answer template for this one. Soon.”
So, let’s take a closer look at the situation, and first I want to walk you through the usual workarounds everybody tries that actually do not work (so I guess they’re just “arounds” :-))
“Around” #1: run tshark instead of Wireshark
There is a simple reason why running tshark instead of Wireshark doesn’t help much, even though tshark is probably less resource consuming than Wireshark simply because it is a console application that doesn’t carry the additional weight of a graphical GUI. And that reason is: the out of memory crash doesn’t have much to do with the GUI.
Update 4: this will become a valid workaround in combination with “Around #2” as soon as Wireshark 2.0 is released (right now we’re still running 1.12 stable), since Evan changed the way tshark works. See the official Wireshark blog post. You can use the developer builds to run tshark with the code change.
“Around” #2: capture packets into multiple files
This one looks promising: instead of capturing all the packets into one single large file we could configure Wireshark/tshark to write a new file after a certain amount of data has been captured. Typical file sizes are 64MB, 100MB, 128MB, 256MB. You could easily configure it in the capture options like this to capture into files of 100MB each: 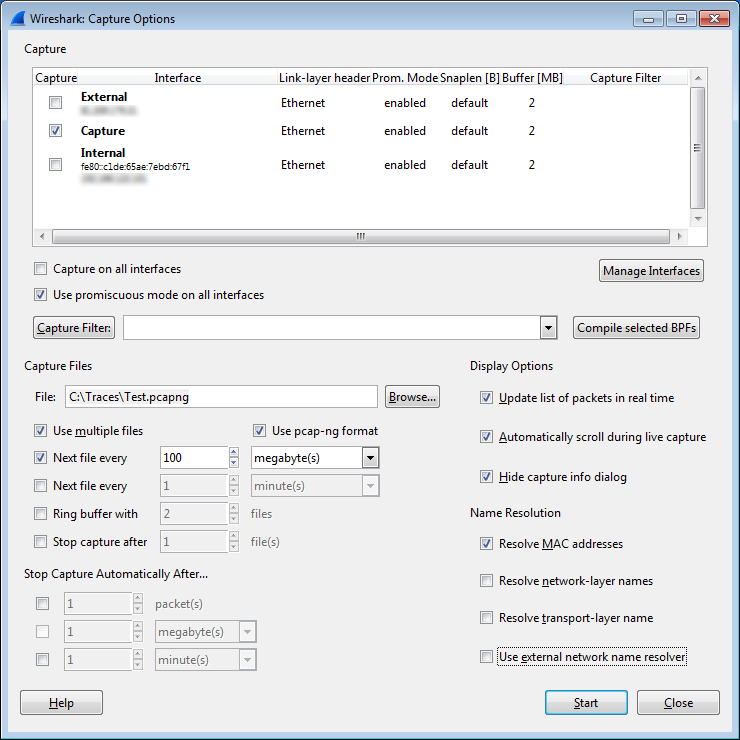
Unfortunately, even though Wireshark will now create a new file each time 100MB were captured it will still crash after a while, which is kinda confusing. Everyone expects that Wireshark does start from scratch each time a new file is created, but well, both Wireshark and tshark don’t. At least not entirely.
Updated (thanks to Anders Broman for getting my facts straight): What most people do not realize is that neither Wireshark nor tShark keep the actual frames in memory – they’re always written to disk sooner or later (usually somewhere between “sooner” and “right away”). The reason for the out of memory situation is that Wireshark/tshark do keep information about each frame in memory, in a structure called “fdata” (frame data). Most things Wireshark displays about a frame is stored in there. Additionally there are hash tables of reassembled data conversation etc, which survive opening new files as for example fragments of reassembled frames may span across two files. Since these structures keep eating memory Wireshark and tshark will still crash after a while.
By the way, this is also the reason why very often pretty large files with big frames can be captured and opened, while small files with very short frames crash. I have a 1.5 GByte pcap file that I can open without any problems, and a 200MB file that crashes Wireshark. The reason is that the big file has a lot of 1518 byte frames, while the small file has tons and tons of 64 byte frames, which create way more fdata structures that cause the crash.
“Around #3”: buying more RAM
Having more RAM might help a little since Wireshark/tshark can capture for a longer time, especially if it is the 64 bit version which can address more memory. But still, it is only a matter of time until all RAM is consumed and a crash is imminent. The flood of fdata structures will eventually take your machine down without mercy. You can run, but you can’t hide.
The solution
There is a simple solution to solve out of memory problem when capturing packets: do not use Wireshark or tshark to capture frames! Use dumpcap instead. In case you’re wondering what “dumpcap” is: it is the capture tool that Wireshark and tshark use to capture data, because neither Wireshark nor tshark can do that. Both of them actually spawn a dumpcap process when you press the capture button or run tshark from the command line, and you can verify it by looking at the processes that run when you do a capture. In my Wireshark classes I usually used Process Explorer to demonstrate to my students that Wireshark uses it to capture packets: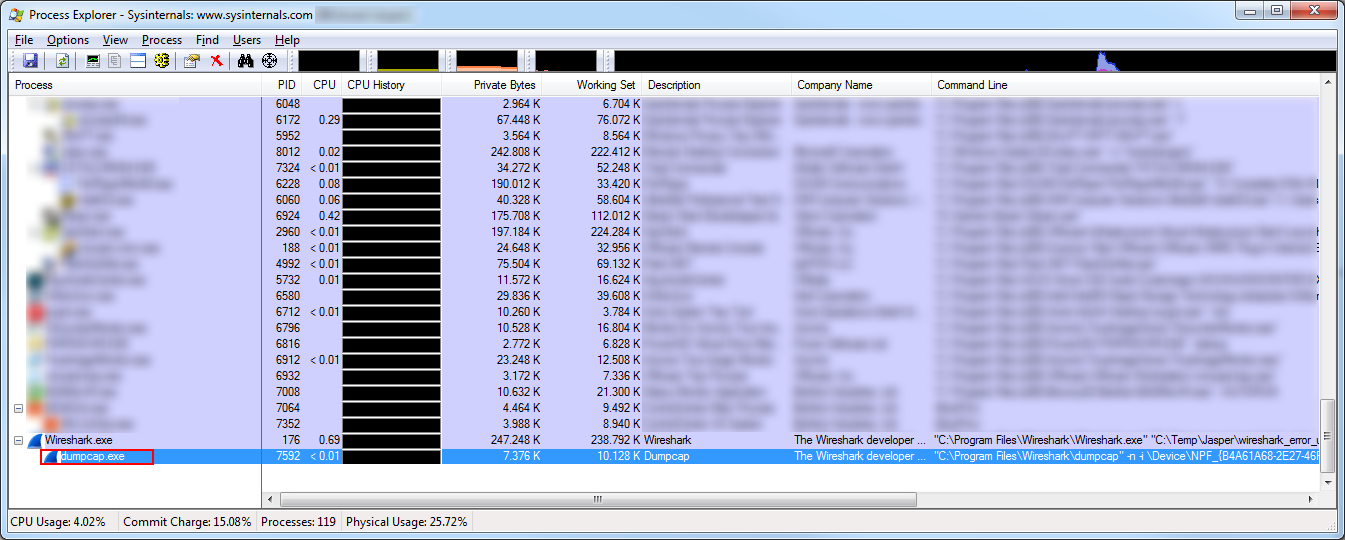
dumpcap is a command line tool that is installed together with Wireshark, and can be found in the same directory. It is a tool designed to capture data from network cards and write them to disk, and all Wireshark does is read that growing file while the capture is running and displaying packets and other stuff to you.
HowTo: dumpcap
Using dumpcap is pretty simple: specify the network card you want to capture data from and you’re good to go. Well, you might actually want to write to a specific file name, or create multiple files of a limited size, but that is no rocket science either – there are a couple of command line switches that can help your with that.
The first step is to open a command prompt or terminal window, depending on what OS you run. If on Windows, chances are that you have used the cmd.exe before, even though it seems like less and less people have ever done it theses days. If you haven’t ever used the command prompt on Windows, don’t worry: press the Win+R (meaning: the “Windows” key and the “r” key at the same time), and write “cmd.exe” into the dialog box that opens. Boom. Welcome to your first command prompt.
Note: if you do not find a “Windows” key on your keyboard you’re either not using a standard PC keyboard or you’re one of these guys who are still using a keyboard like those from before there even was a thing called “Windows”. Which means that I don’t need to tell you about command prompts at all since you still know all those autoexec.bat and config.sys parameters to make the most of your 640k from the back of your head.
Anyway, try to run dumpcap.exe by entering it at the prompt: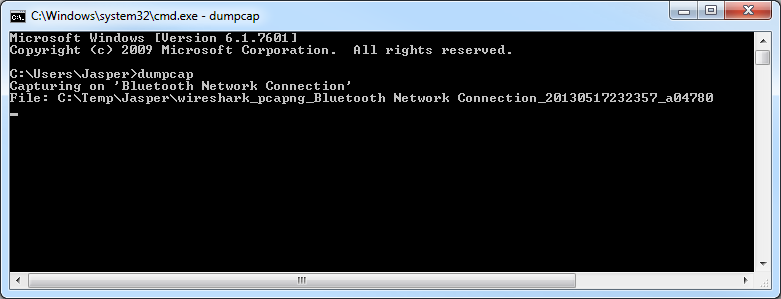
One of three things can happen:
- Other than my screen shot, you’ll get an error message telling you that dumpcap wasn’t found. Don’t worry, it’s there but the command prompt didn’t know where to find it. Try entering “cd \program files\wireshark” (works for the 64 bit version or on earlier Windows systems than Vista). If you get another error try the 32 bit version, by entering “cd \program files (x86)\wireshark”. Now try entering “dumpcap” again and it should work. If not, try using the desktop search to find the dumpcap.exe and change to that directory (“cd” stands for “change directory”. Just in case).
- Like on my screen shot above, dumpcap starts capturing data on some network card you don’t want to capture on – in my case my Bluetooth connection. Well, dumpcap uses the first interface it finds, unless we tell it to use a specific one.
- dumpcap captures on the correct interface, but into a file you don’t want.
Selecting the correct capture interface
So, let’s tell dumpcap what interface to use to capture. To do that, we need to find out which ones are out there. Stop dumpcap by pressing CTRL-C. Then run “dumpcap -D” to see a list of all interfaces that are available:
C:\Program Files\Wireshark>dumpcap -D
1. \Device\NPF_{3F324CFC-62E7-4599-ABB7-7A1B97F67F9B} (Bluetooth Network Connection)
2. \Device\NPF_{AF3EED38-EEA5-49AF-8205-CF87500A46B0} (VMware Network Adapter VMnet8)
3. \Device\NPF_{B4A61A68-2E27-46FA-BB69-098FFFFCC2C2} (Onboard)
4. \Device\NPF_{7FEF773B-E0F0-4395-B1AF-87D21F974C78} (Capture Uplink B)
5. \Device\NPF_{74E904E4-0DAA-4546-8B82-E090869A87FA} (Capture)
6. \Device\NPF_{CD859E57-C14C-4189-8786-1A5684D43F55} (OpenVPN)
7. \Device\NPF_{E1436E20-09CF-4E08-80CC-933EE947BC74} (Capture Uplink A)
8. \Device\NPF_{C5821FC8-74E3-4F89-92EF-199AC8B57FFC} (VMware Network Adapter VMnet1)
9. \Device\NPF_{52764078-022B-450E-BE18-70761C12F456} (VMware)
In my case, I got a lot of interfaces, and you can see why Bluetooth was chosen as a capture adapter: it was the first in the list. Let’s say I want to use the interface called “Capture”, which is very simple: just call dumpcap with the “-i” parameter and tell it the number of the interface you want:
C:\Program Files\Wireshark>dumpcap -i 5
Capturing on 'Capture'
File: C:\Temp\Jasper\wireshark_pcapng_Capture_20130517234017_a05024
Packets: 17
Selecting the capture file name
Better, but still not good: the captured packets are written to some random file name in the temp directory, so we add another parameter to specify the file name, which is “-w”:
C:\Program Files\Wireshark>dumpcap -i 5 -w d:\traces\test.pcapng
Capturing on 'Capture'
File: d:\traces\test.pcapng
Packets: 25
Now we capture on the correct interface and into a file that we specified. The last thing we might want to do is have dumpcap capture into files of a certain size.
Specifying the capture file size
The reason for that is that we probably want to open the files in Wireshark later, and if we capture files with too many packets it will once again run out of memory because of the darn fdata army. Fortunately, dumpcap can create new files after a certain threshold was reached. That threshold can either be the file size or the duration of the capture. I usually use 64MB or 128MB depending on my mood and the type of data I capture. Let’s try 64MB (65535 kb) files, using the “-b filesize:kb” parameter:
C:\Program Files\Wireshark>dumpcap -i 5 -w d:\traces\test.pcapng -b filesize:65535
Capturing on 'Capture'
File: d:\traces\test_00001_20130517235548.pcapng
Packets: 13
Whenever you create multiple files, dumpcap will append a running number to the file name, as well as the year, month, day, hour, minute and second the capture was started. That way you’ll always end up with unique file names. By the way, you can always run “dumpcap -h” to get a help listing including all parameters that you can use.
Setting up a ring buffer capture
The last thing that you might want to do if you expect the capture to run a long time and you have to consider the available free disk space is a ring buffer setup. That means that dumpcap will overwrite old files when a certain amount of of them has been written to disk. Let’s say we have 100GByte of free disk space, but the capture has to run for days until a problem shows up. With a file size of 64MB we calculcate like this:
100GB * 1024 / 64MB = 102400MB / 64MB = 1600 files that we can store (always round down). It’s safer to leave a little more extra room, so let’s go for 1500 files. The dumpcap command line will be extended with the parameter “-b files:1500”:
C:\Program Files\Wireshark>dumpcap -i 5 -w d:\traces\test.pcapng -b filesize:65535 -b files:1500
Capturing on 'Capture'
File: d:\traces\test_00001_20130517235548.pcapng
Packets: 26
Multi-Interface captures
Sometimes you may want to capture on more than one interface at the same time. Dumpcap can do that, too (of course, since Wireshark relies on it every time it captures – I think I mentioned that a few times already). So here’s what it can look like:
C:\Program Files\Wireshark>dumpcap -t -i 3 -i 5 -w d:\traces\test.pcapng -b filesize:65535 -b files:1500
Capturing on 2 interfaces
File: d:\traces\test_00001_20160116161934.pcapng
Packets captured: 585
Note the new parameters “-i 3” for just another interface (with index 3 taken from the list we saw above when using “-D”). We simply specified the “-i” parameter twice, once for each interface. The additional parameter “-t” tells dumpcap to use a separate threat per interface to balance the load.
Final Words
Congratulations – you should now be able to capture without a crash for as long as you like (well, and as long as your hard drive has space left, of course – you can use the ring buffer parameters to get around that one, too). And the capture performance is the best you can probably get since you do not have Wireshark or tshark putting additional load on the system by reading the file you’re just writing. And it’s scriptable, too.
Finally, let me show you some light at the end of the long tunnel of out-of-memory situations: Wireshark is part of the Google Summer of Code 2013, and one of the goals that were specified was to reduce the memory footprint of Wireshark by using file-backed tvbuffs. So there is hope that in the future we will see less out-of-memory crashes, and we will finally have less question about it on ask.wireshark.org 🙂 But there will still always be the other one about capturing WiFi…
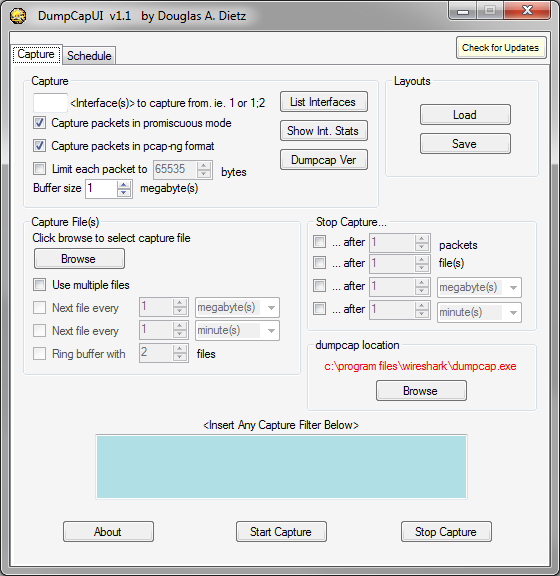
Update 2: If you run Windows, check out this little tool Doug mentioned in one of the comments below. It is a nice front end that helps you setting up dumpcap captures and allows storing and retrieving them at a later time:
Good job, Doug!
Update 3: There also was a memory leak in GTK that could be the cause of the problem. This has been fixed in version 1.11.4-417 or later.
Update 4: Check out the dumpcap batch script Christopher mentions in the comments below. You can find the current version at the Wireshark tool link wiki page. Thanks, Chris, good job!
Update 5: added multi interface capture syntax example
Thanks for your post. Very good!
I´d just like to add a command to limit the number of files (to save disk space). It should be:
dumpcap -i 5 -w d:\traces\test.pcapng -b filesize:65535 -b files:10
Dumpcap will delete older files keeping only the last 10 files.
Thanks again
Jair.
Hi Jair,
you’re right, with that command you can capture in a ring buffer of files, which is very useful when disk space is limited or the capture will run for a very long time. With -b files:n you can make sure not to run out of disk space.
I hope you don’t mind, but I added a link to this article from the Wireshark wiki page, http://wiki.wireshark.org/KnownBugs/OutOfMemory.
Of course not – whatever helps to reduce the load of those questions on ask.wireshark.org is fine by me 🙂 Thanks!
I see your blog here https://blog.wireshark.org/2014/07/to-infinity-and-beyond-capturing-forever-with-tshark/
knowing that “-b” flag to tshark can solve capturing may be 100G data.
recently I am using lua script on wireshark,just like
tshark -X lua_script:createNewPcap.lua -r oldPcap.pcap -q
wireshark version is 2.0.12 on centos7,RAM 4G,when pcap size over 4G,it keeps crashing.
in this case,how can i avoid memory crashing,thank you.
I guess the amount of packets is just too much for tshark – it will consume memory while processing, and there’s not much you can do. Usually I’d recommend processing smaller PCAPs and aggregating the results, but that requires additional effort, of course. 4G in a single PCAP is quite a lot.
Hi, i’m using Wireshark to analyze network but actually I don’ want to wrire a pcap file. I process the messages one by one, in real time, right after the message comes. After that, the message should be thrown away. So, I wonder, if I use tshark just to display some fields on screen, and nothing more, nothing saved, does it cause the out of memory when i leave it running 1 weeks or even 1 month …?
Yes, I think it does, because it will still keep the fdata in memory. I don’t think there is any kind of parameter that you could use to prevent that kind of behavior.
And tshark always captures to disk, so there is always a pcap written, which grows while tshark is running.
So, if I use tshark, the only way to prevent this problem is code modification, right? Dumpcap cannot solve problem of mine because as I know, dumpcap just supports some protocols, not like wireshark or tshark. In my case, it does not support camel message. About the pcap file writen to disk, I think your solution could be useful in my case.
And one more question, I wonder why tshark stil keep the data in memory while it also write data into pcap file. is information in pcap file is not enough? And why tshark still keep data in memory, for what? while we just display data on screen without using “save file” option.
That is because tshark might have to show TCP expert messages for future packets, which is usually based on their relationship to previously seen packets. E.g. things like a missing segment, which can only be diagnosed if keeping the “old” sequence number in mind to see if there is a gap.
So tshark writes the packet contents to disk, and keeps the meta information in memory, because the expert messages are not stored with the packets.
I’ve run into the same issue many times, and decided to write a frontend to dumpcap because the commands can get extremely daunting. UI allows you to save/load layouts, and also takes advantage of windows task scheduler so you can schedule captures at specific times. Freeware. Feel free to share:
http://www.netskillz.com/dumpcapui/
Thanks Doug, I’m sure this can be useful for a lot of people – I myself prefer the command line, but I’m kinda old school that way 🙂
I posted the following notice a couple of months ago. It’s basically a command-line front-end for dumpcap on the Windows platform, written in batch, but it adds event notification capability through the use of mailsend. Not much feedback, so maybe nobody finds it that useful, I don’t know. If you do decide to download and try it, be sure to read the entire thread, as the batch file was modified in transit and I point out the differences and provide updated hashes.
http://www.wireshark.org/lists/wireshark-users/201405/msg00030.html
Nice! I guess maybe it was just too hard to find? Let’s hope we can increase usage when people see your comment on this post – it is still by far the most popular posting in this blog 😉
FYI: An updated dumpcap.bat is now posted at http://wiki.wireshark.org/Tools.
Hi Guys, how about filtering specific ip address using dumpcap command?
You can do that by specifying TCPDump style capture filters using the “-f” command line parameter, e.g.
dumpcap -i 5 -w test.pcapng -f “host 192.168.0.1”
Jasper, thank you for posting this.
I know this is going to sound like heresy, but I think maybe this really is Wireshark’s fault, in the sense that the GUI isn’t conforming to the principle of least astonishment (http://en.wikipedia.org/wiki/Principle_of_least_astonishment).
If someone selects for Wireshark to write out multiple files, then perhaps what it should do is in fact reset internal state/frame-data whenever it closes one file and opens the next – it’s not like the features that the saved frame-data enables are actually usable across multiple files anyway, once the human re-opens one of those files later on. For example if you open one of those files later, it can’t reassemble segments that aren’t in that file, nor find request/response matches if either the request or response isn’t in that file, etc.
So maybe what the questions on ask.wireshark.org are saying is that our model isn’t right, instead of the users aren’t right.
I think you have a point. I am a big fan of good user interface designs, even though it often is a pain for a programmer to make complex things easy to use. It is exactly the reason why it takes me ages to put features into TraceWrangler, because things like sanitizing network packets is insanely complex. Creating the GUI that has to make it easy to configure those complex replacements is almost taking more time than coding the logic of the replacement process.
And in the case of multi file captures you’re right – users expect Wireshark to treat files as independent entities when capturing them, but since it doesn’t do that they’re surprised that it still crashes. I am not trying to defend that behavior in this post, I was just explaining the workaround. And in calling it a workaround it is obvious that this is not really the right way to do things. Workarounds should not become permanent solutions, even though they often seem to be.
Maybe the developers can find a different way of doing multi file captures in the future, but as of now it seems that running dumpcap is the only way of avoiding the crash.
While I personally still prefer to use dumpcap for long-running captures, it should be possible to capture “forever” using tshark: https://blog.wireshark.org/2014/07/to-infinity-and-beyond-capturing-forever-with-tshark/.
The blog indicates that it should also be possible to accomplish this with Wireshark too but that more work is needed first. Perhaps if a bug is opened or if someone pinged Evan Huus about making the necessary changes to Wireshark, then who knows, one day it could be possible with Wireshark too.
I’m capturing and displaying SNMP packets. my capture has stopped. I’m just browsing the captured packets. If I select the first packet, the memory use goes up. if I select the second packet the memory use goes up.
My question is, why, when I select the second packet again, the memory use goes up.
if I press up, down, up, down. the memory use goes up a lot, and just doing that can go out of memory.
what is it putting into RAM that it doesn’t have already?
Is that not a leak?
Sounds pretty much like a memory leak to me, which would make this a bug. You could open a bug report at http://bugs.wireshark.org to let the developers know about it.
Great article. I found your article while using Wireshark to capture voice calls looking to prove there was no static in VOIP streams across the wire; that it must be a local problem beyond where I terminate a SIP-trunk to my customer. While using Wireshark I thought, “How useful would it be to keep a running window of packets for a few days to a week, so if somebody reported a voice issue, I could go to the capture to see if what they reported was there. I figured if there was some way to have a constantly sliding window of packets captured for analysis for a set amount of time before they fell off or were pruned if you want to think of it like that (a few days, a week, etc) then it would be a useful tool if people reported voice issues. Seem likes that might be more difficult than I originally thought.
Larry, i am running an national VoIP service, and with dumpcap i am logging all VoIP packets to files 24/7 for later analysis of reported customer complaints. So far it has been running flawless for 2 years.
Thomas
Thomas, can you provide a sample dumpcap command? The problem I see is that by setting a specific file size, chances are good that calls will be segmented between files. Do you see this happening?
This is inevitable, but should not cause too much trouble, as Wireshark can merge multiple files, or you can use mergecap for the same purpose if you need CLI for scripting.
So when you need to see the call of interest in its entirety, all you have to do is to identify all files over which the call spans – the call start/end timestamps in the CDR and the timestamps of the files are the key here – and merge them together.
Or you may run the captured files through tshark, filtering on SIP Call-ID for signalling and for IP addresses and udp ports for RTP, and merge together only the resulting files. This way, you reduce the size of the file to be transferred and analyzed to the necessary minimum before opening it in WIreshark.
I am capturing packets from DPDK mostly UDP and TCP packets.After 3 Mins the Wireshark just halts.Can you please tell the possible reason for the same.Early response is highly appreciated.Also how to solve the problem.
Did you try capture with dumpcap instead, like the post suggests? I guess Wireshark is running into trouble at some point, so please try capturing on the command line with dumpcap instead.
I know this is an old post, but i wanted to thank, it helped me.