Tweaking Wireshark Columns and Decodes
It’s a funny thing about using Wireshark – I think I am pretty good at using it in an efficient way, but there are always some new tricks that I learn every once in a while.
The Multi IP layer problem
Maybe you have seen this in a trace before: some packets contain more than one network layer, e.g. when tunneling IPv6 over IPv4, or IPv4 over IPv4: 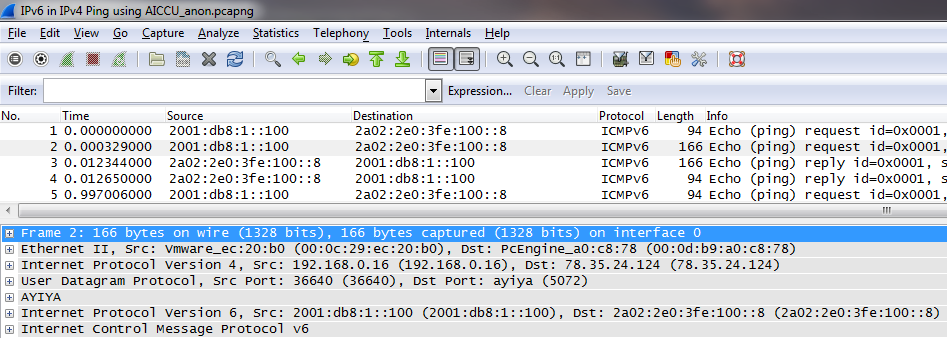
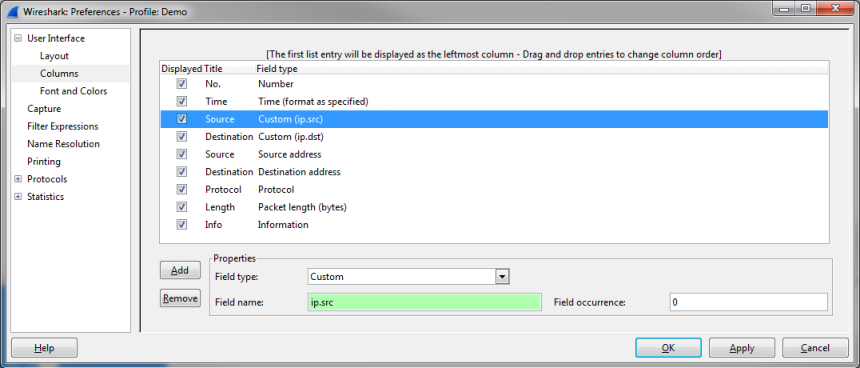
The problem is now that Wireshark only displays the IPv6 addresses in the “Source” and “Destination” column, but you can’t tell from the packet list that there was an IPv4 layer used as a transport tunnel underneath. That is because Wireshark will always display the Source/Destination address pair of the highest layer it can find, which is IPv6 in this case. Now, if you want to see the IPv4 layer addresses as well you can add custom columns using the “ip.src” and “ip.dst” display filters: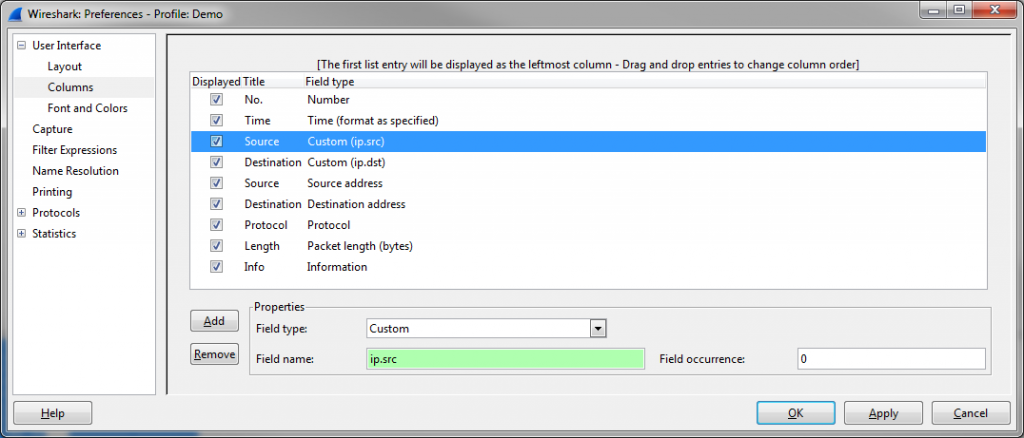
This will result in the following output, where all packets that have been tunneled have the additional IPv4 addresses displayed in two additional columns:
The Multi Layer field problem
Sometimes, you may end up with a trace that has multiple occurrences of a field in different layers. Adding a custom column that displays those fields will end up showing all values, separated by a comma, as seen in this “IPv6 over IPv6 tunneling” example: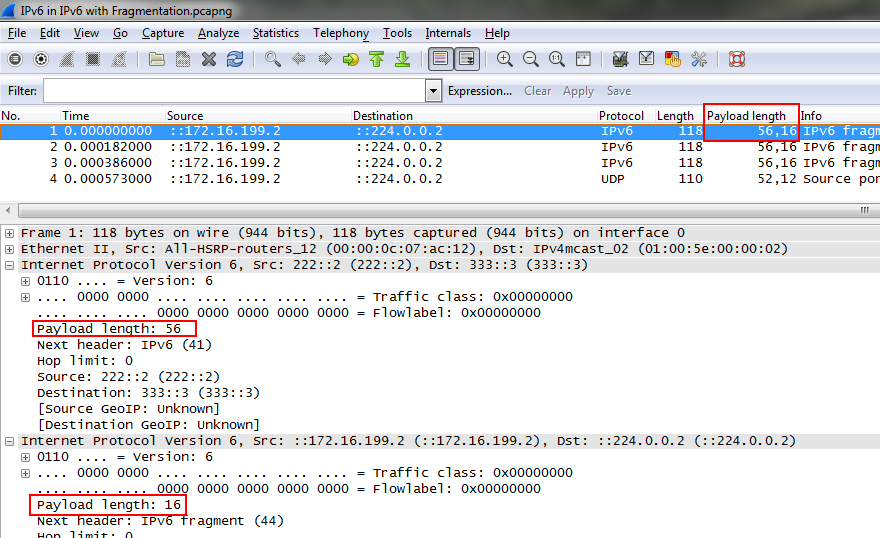
Now, if you want to see only one of them in your column you can use the “Occurrence” setting for this column: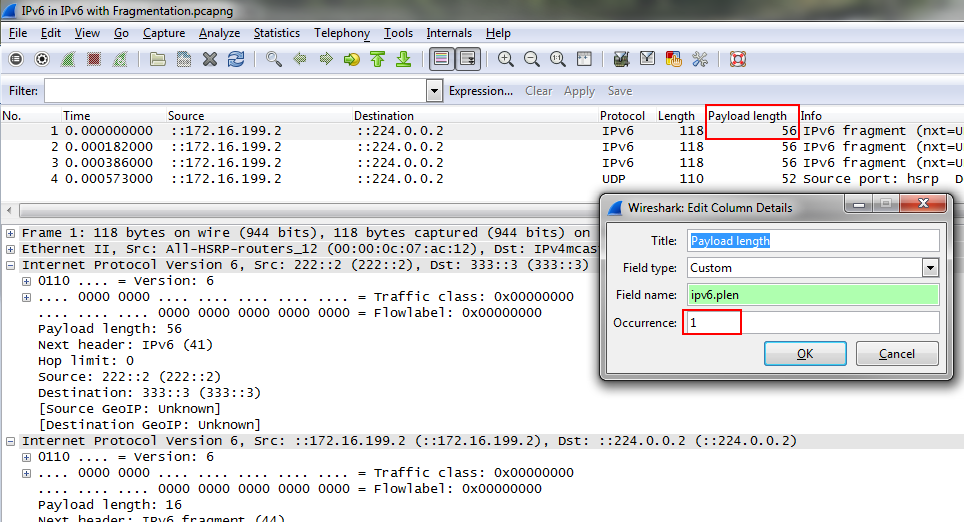
Depending on what occurrence you need you can tell Wireshark which one it should display. If you set it to 0 it will display the comma separated list, but if you set it to a higher number it will show that specific occurrence.
The hidden protocol fields
Did you know Wireshark doesn’t always display all fields in the decode pane that it knows about? Take the length of the TCP segment for example – at the moment most of us read the length from the TCP protocol header line – it is not shown in any of the fields of the actual TCP decode (as of writing this post, Wireshark version 1.10.2 is the current stable version):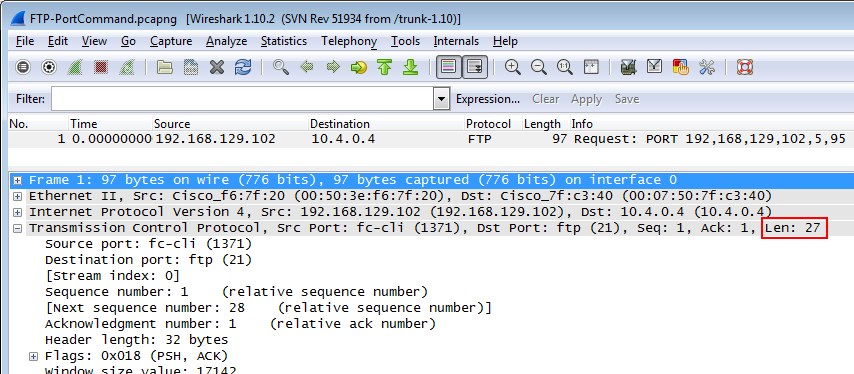
Obviously, Wireshark has that length stored somewhere, because you can see it in the TCP protocol summary line above, and also filter on it by using “tcp.len”. It is actually stored in so called “hidden protocol items”, which you can force to be displayed by going into the preferences and selecting the following check mark:
As soon as you have done that, you will get a decode that looks like this: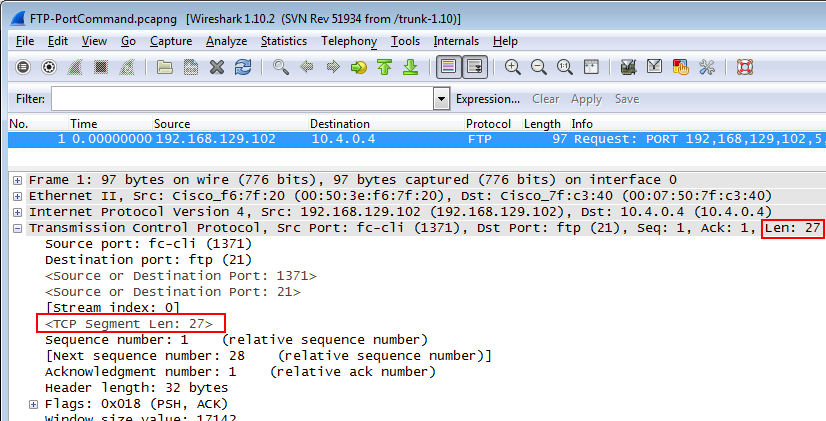
The hidden length field is now displayed. You can tell that it is a “hidden item” by the pointy brackets “<” “>” around the field, as well as the color being gray. If you take a look at the two other hidden items it might give you a hint how the “tcp.port” filter works – it looks at both source and destination port, and there’s a hidden item to help with that.
By the way, in the current developer builds of Wireshark the TCP length field has been introduced as a helper field that is always visible, while the “source or destination” items are still “hidden items”: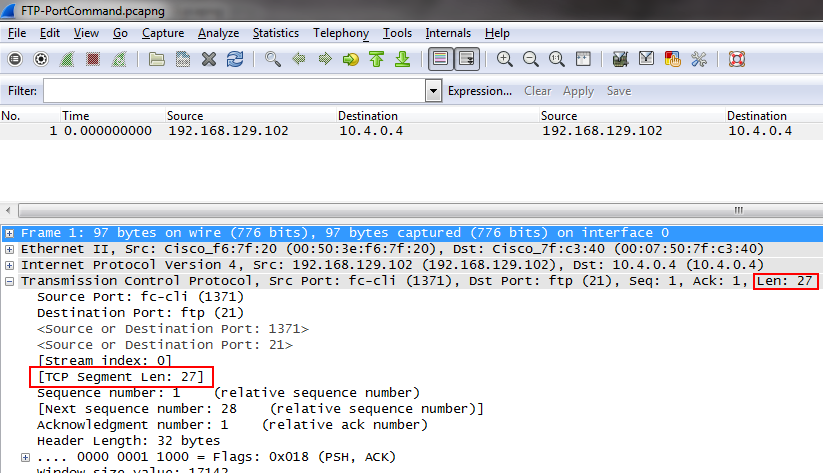
Well, that’s all for now. Happy trace file reading! 😉

very informative…. keep it up.