The Megalodon Challenge
This year at Sharkfest I offered a special capture file challenge I called “The Megalodon Challenge”. Other than the “normal” challenges you could find at The Reef it was not limited to the size of 100MB, and the solution cannot be reduced to a couple of words or numbers. After Sharkfest I was asked if I could put up the challenge so that people that haven’t been at the conference (or didn’t know about the challenge) could give it a shot. So here it is.
Introduction
The Megalodon Challenge is bigger and a lot more complex than the usual Sharkfest capture file challenges. There are no highly specific questions that can be answered with a definitive answer. The general idea is to have participants solve a real world network analysis problem, with all its confusion, drawbacks and uncertainties.
To achieve that kind of experience all participants will receive the same rather large capture files that have been taken (and sanitized, of course) from a real life analysis job solved by myself in November 2014.
Scenario
It all started with a phone call on a Sunday afternoon. The CTO of a company in the online travel business called me about a problem his development team had with the new online web portal that was about to go live in the next couple of days. During the preparation of the new portal the team had performed a stress test to check how the web pages would behave under high load.
Unfortunately, the test had not been successful, and to makes matters worse nobody knew exactly why not. At a certain point in time during the test there would be unanswered page requests, but it was unclear if it was a network problem, an application framework problem, or something in the application logic itself. Or maybe even something else entirely.
The good thing about the situation was that the problem had already been pinpointed to the communication behavior between two server nodes that were part of the web portal infrastructure. The first server was a web application server, querying a content server for web page elements. It seemed that at a certain point in time, the web application server would not get a reply for some of its requests anymore.
The capture setup
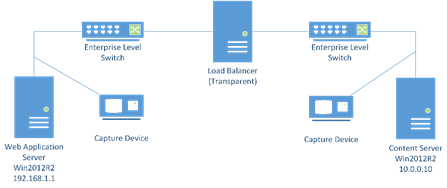
Designing a capture setup can be a complex task, but in this situation it was actually pretty simple: both the application load balancer and the content server were captured at the same time. Both servers were running a Windows 2012 operating system, and both were connected with Gigabit links to switches. The communication had to run through an additional transparent network load balancer. This is the network diagram:

Both servers where captured using Gigabit copper aggregation TAPs by pulling the server cable from the switch and running it through the TAP into the switch again.
Your task
Determine the cause of the problem. You should work towards a solution proposal you can give the customer in your report. In the end, the customer needs an action plan or at least a recommendation. You should also be able to tell if “it’s the network” or not.
In this challenge, while your role is being the network analyst, I (Jasper) will “play” the customer. So if…
- …you have questions about anything that you think will help in your analysis, just ask me. You may get a more or less specific answer
- …there is anything you need, tell me. Maybe I can help.
- …you get stuck, talk to me as well for some hints to keep you going
Best would be to send an email to jasper[ät]packet-foo.com, but you might also try Twitter if you want.
Materials
Heavily sanitized capture files are available as a download of a 7zip packed folder, including the original PDF with the same instructions as above:
Deadline
Deadline for the challenge will be end of September, so I’ll post a solution (or whatever it is I found 😉 ) in October. Please be patient with me – during Sharkfest I could spend a lot more time on participants asking questions than I can now. EMail answers may take a few days, especially since I’m talking to multiple people sending me large emails with a lot of details and questions.
Update 1:
I received a couple of questions regarding the challenge, so here some additional details that may help:
- Of course all capture files are sanitized – they’re taken at a customer site during a real network analysis job!
- the two capture files in the 7zipped file may look like they’re the same. They’re not – one was captured at the web application server, the other at the content server
- The capture was designed to be using full duplex copper TAPs in breakout mode, using a Network General S6040 Gigabit capture appliance to record both locations on a single device at the same time. The TAPs were approximately a few meters apart from each other. Unfortunately, the S6040 experienced a hard disk failure on boot, refusing to start the sniffer application. It had worked fine during the equipment test the day before.
Time was of the essence, so I changed the capture setup on the fly to using two copper TAPs (Garland P1GCCA and ProfiShark1G) in aggregation mode, and recording the packets with two parallel dumpcap sessions on my laptop instead. The laptop specs were: Core i7, 24G RAM, 256G SSD running the OS, secondary 1 TB SSD for data. - The load balancer in the diagram seems to confuse some participants. I put it into the diagram because I was told by the customer during the analysis job that it was part of the communication. I have no further detail on how it works exactly.
- The protocol used between web application server and content server is proprietary. Wireshark wasn’t able to decode it before sanitization, so there’s no big difference to the sanitized version. It’s working in request – response mode basically.


Thanks Jasper for the clarification on the big pacp, here is my note:
— All the TCP data are sanitized,
— the communication between Web-App-server and content-server is request/response mode.
— A request typically has one data packet (but can have more), each response typically has multiple data packets.
— If the request and response data size is less than 32, it is not a request or response, it’s a keep-live message, no need to worry about them.
Hi Jasper,there are 2 captures provided one each for web and content server,but it looks that its same capture file with different names.when i compared single tcp stream for e.g tcp.port eq 59438,i saw no difference,ideally i should see change in mac-add,ip.ttl values.ip.ttl value captured for web server is same on both pcap file though they are taken at different points.Am i missing something?
Hi, I updated the post with some more details.
When will you post the solution? 🙂
Since I haven’t been able to reply to all the emails of participants in the last couple of weeks due to intense work and private reasons I’ll postpone the solution for a little longer. Stay tuned 😉
Any updates? 😀
Yeah, I’ll work through the challenge emails this week, and then see how soon I can post the solution. Sorry for the delay, but I haven’t forgotten.
Happy New Year! 🙂
Thank you, Happy New Year to you and everybody else! 🙂
Any ETA for the solution Jasper? 😀
Yeah, I plan to post it until end of February, maybe sooner.
Thank you Jasper!
Still not able to work on the solution post due to private reasons, but it’s the next thing I’ll do when there is any kind of free time
Thank you Jasper!