A look at Cisco Tetration
Once again I was invited to join the group of delegates for Tech Field Day Extra at Cisco Live 2018 in Barcelona, with various presentations covering a number of new and improved Cisco technologies. One of them I had seen already last year at the same event in Berlin, but hadn’t had the time to cover it in a blog post: Cisco Tetration.
In general, Tetration reminds me of what we usually do with Netflow: gathering meta information about things happening in the network (also known as “Network Telemetry”), without keeping full packet captures – which, as far as I’m concerned, still is the ultimate truth of what’s really going on. It’s hard to argue with a precise packet capture. Anyway, Meta information has the general advantage of being small and keeping only the most important aspects and extracts from the real data, so you can store it for a much longer time. And Netflow has evolved over time, being able to extract more and more interesting details from the packets it sees.
Tetration seems like a big step further in the same direction, and the main goal is to provide visibility into the ever growing complexity of modern networks. We’re not just doing the old North-to-South communication anymore, but there’s data flows everywhere now – including various types of clouds. Tetration is designed to help monitoring that, and also to help understand application data flows which get more and more complex all the time as well:
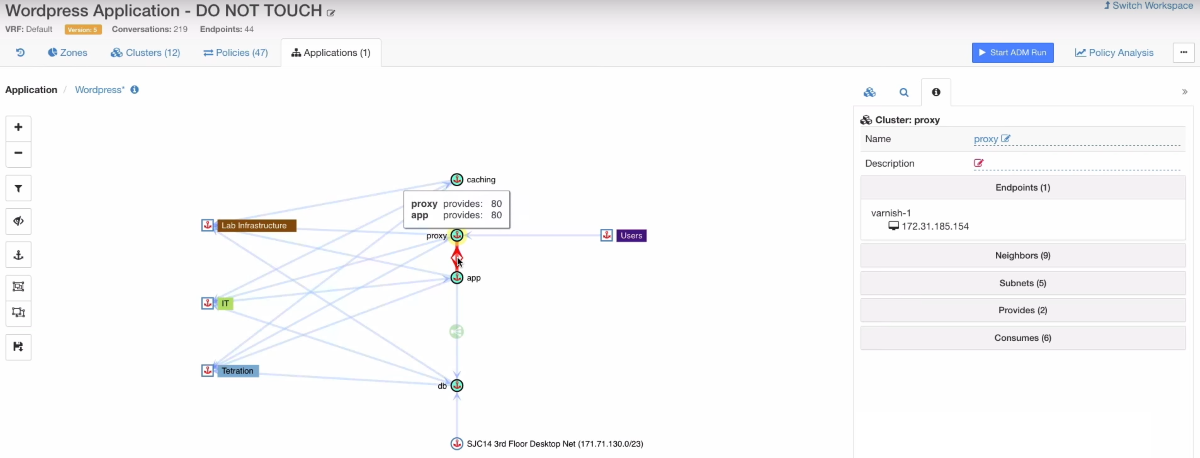
Figure 1 – Tetration Application Analytics
Architecture Overview
Let’s do a quick recap for those who haven’t heard about Tetration before. Tetration is in it’s core an analytics engine, which is probably why it’s sometimes referred to as “Tetration Analytics” when Cisco is talking about it and it’s using its own encrypted telemetry protocol instead of sFlow or Netflow. The Analytics engine is available in a couple of different form factors (requiring either 8 or a whopping 39 Rack Units), plus a cloud version. Of course an engine needs some data to work with, and you need to be able to pull results from it. Which is why the architecture overview doesn’t come as a surprise:
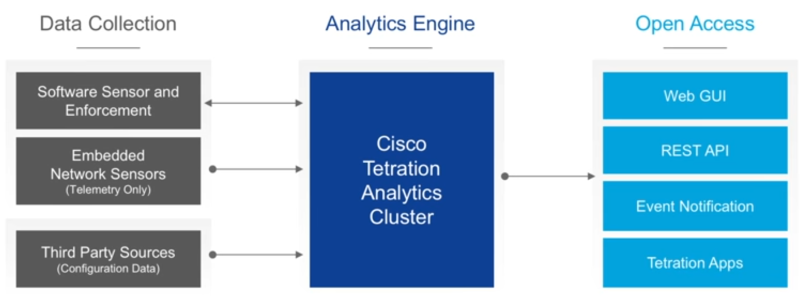
Figure 2 – Tetration Architecture
The data collection is mostly done by two different types of sensors: hardware and software. Hardware sensors are build into the Nexus 9000 series switches (and as far as I know only those) , which capture network flow data at very fast export intervals (not requiring sampling) and without performance penalty to the “normal” traffic. The software sensor is an agent that is installed on the OS of servers and PCs (Linux or Windows), and can gather additional information on top of the flow data, e.g. process and user information. Third party source can be service devices like loadbalancers providing configuration details to allow greater insight in their operation.
Of course an analytics engine is only useful if there is a well designed user interface to query the results. What impressed me at Cisco Live 2017 was how fast the search GUI reacted even with millions of flow stored in the cluster. The look of the user interface reminds me (like most these days) of the way Splunk is doing it:
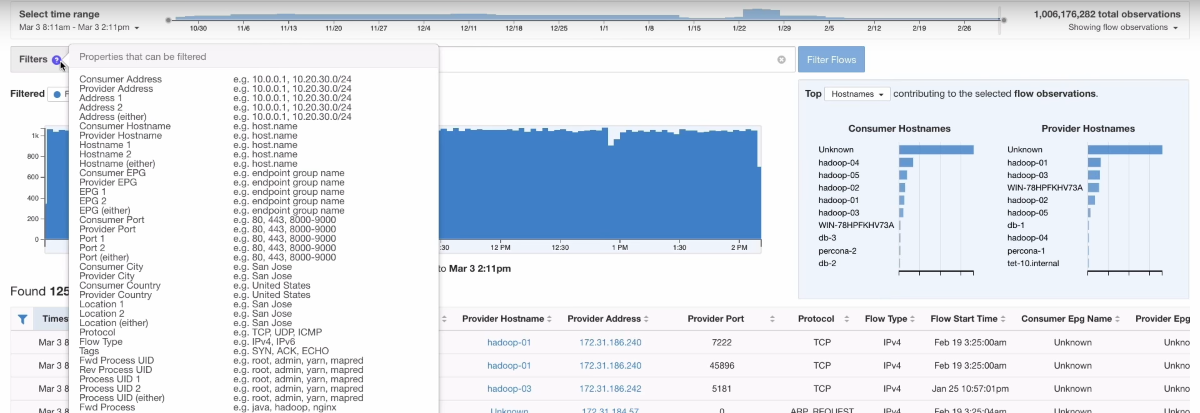
Figure 3 – Tetration Search
Tetration at Cisco Live 2018
Okay, back to Cisco Live 2018 – Rémi Phillipe and Tim Garner presented the new things you can do with Tetration now.
New Sensor Types
- container host sensors, which works exactly like the software agent in a Linux or a Windows host
- ERSPAN sensors, which can be used to ERSPAN packets (e.g. of a “good old mainframe”) to a sensor VM to get the Tetration Telemetry.
- Netflow (which Rémi called a “last resort option”)
Tag grouping
Tetration is now also able to get more dynamic context data to enhance the telemetry data with, e.g.
- Kubernetes attributes
- VMware vCenter virtual machine attributes
- AWS tags
- User-uploaded tags
Those additional tags can used to group devices by function to make it easier to handle them, especially if the devices are spread across heterogeneous architectures, e.g. some of them living in Kubernetes clusters and others in a vSphere infrastructure. So it becomes less relevant where and what type a specific device is, because it’s grouping is based on tags:
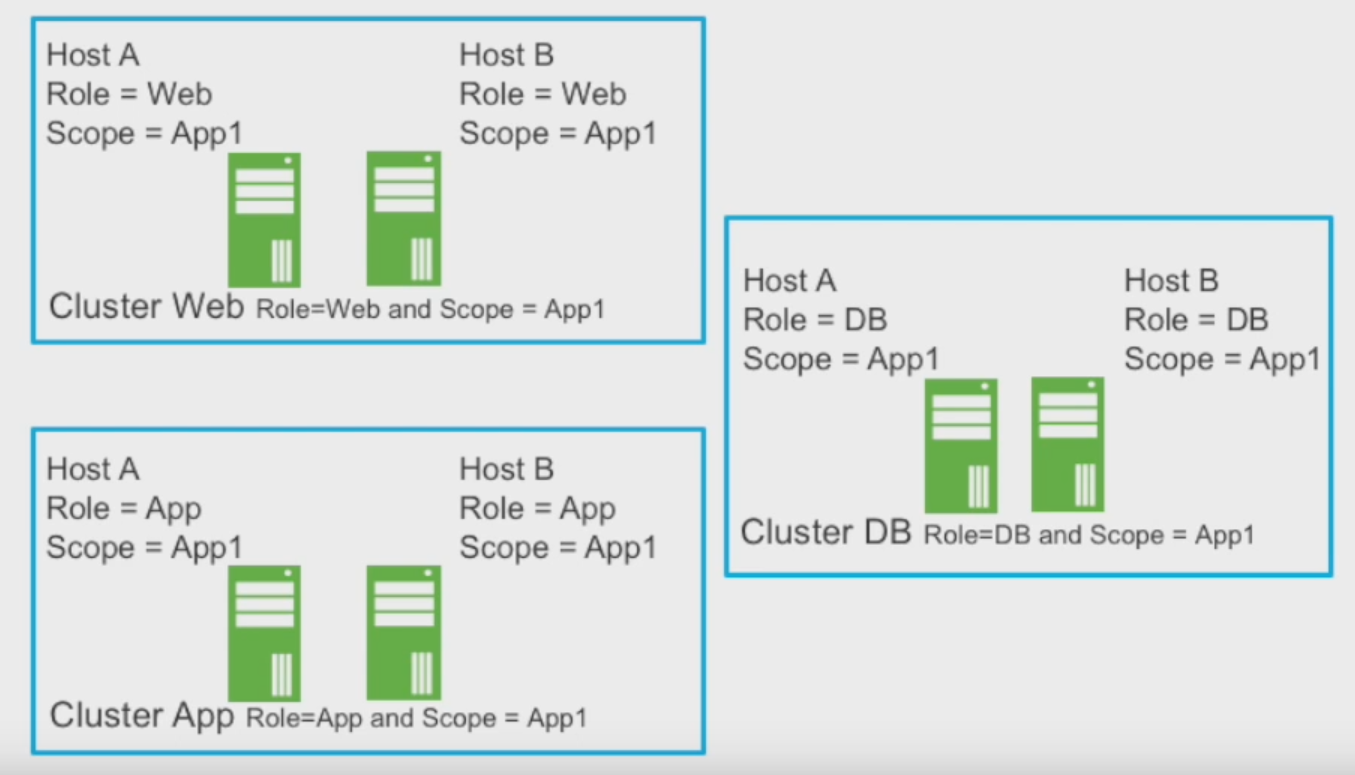
Figure 4 – Grouping of devices
I think this is really helpful as we all know that there is no such thing as a homogeneous data center architecture – at least not for a longer period if time, as change always happens.
Policy Enforcement
Another thing you can do with the tags is defining policies, which is pretty nice. When adding a new device with a certain tag, it will automatically have the policies applied for the tag group:
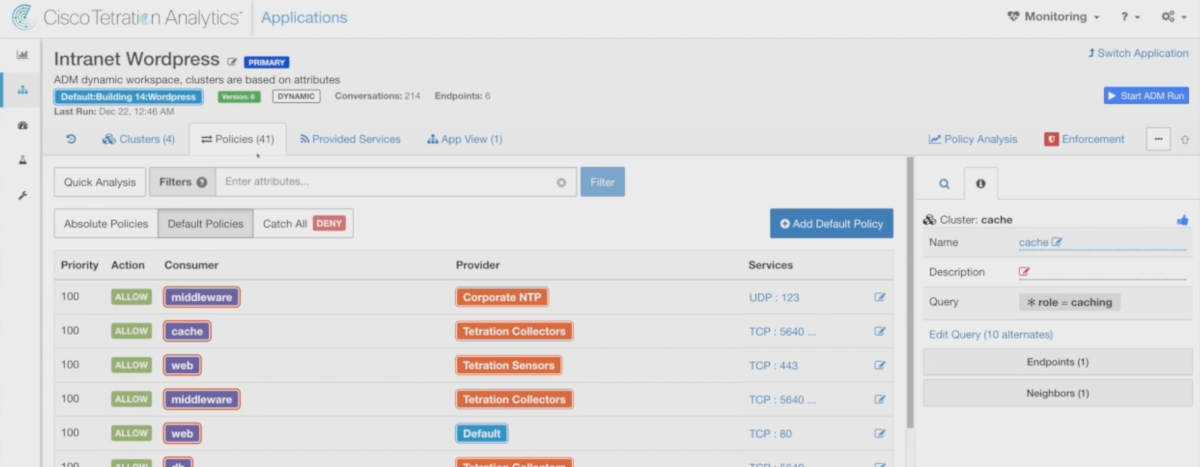
Figure 5 – Policy Settings
This is really useful, because it reduces manual work and can prevent forgetting to set certain policies for a new device you’re deploying. The question is now – how are the policies enforced? First of all, the policies need to be defined for both incoming and outgoing traffic – meaning there is no “allow all” for outgoing traffic from a device, like many of us are used to. When a connection is established for the first time, Tetration will notify you and allow you to accept or refuse the connection as part of your policy:

Figure 6 – Set a new policy
The policies themselves are enforced via the Tetration agent and iptables (on Linux) or the Windows host firewall. Cisco is currently looking into enforcing the policies on the network as well. So for me it looks like Tetration is basically requiring that you deploy their agents to be useful in regards to enforcing policies at this time.
Network Performance, Monitoring and Diagnostics
Other than being a tool for security topics, Tetration can also be helpful for monitoring and diagnostics tasks for the network. It helps answering questions like
- what applications are actually running on the network and (and this is usually a mystery to most network people I meet) what communication flows do they really use?
- where do we see congestion, and which applications flows are affected?
- which traffic is going through which links?
- where are packet drops happening?
- what is the latency?
Tetration is able to provide answers because it can combine telemetry data from the host agents, knowing which applications holds which sockets at what point in time. And it knows what happening with the communication flows during network flight (if there are Cisco 9000 switches in place, or some of the other sensor types). The host sensors alone are able to provide some answers for common questions:
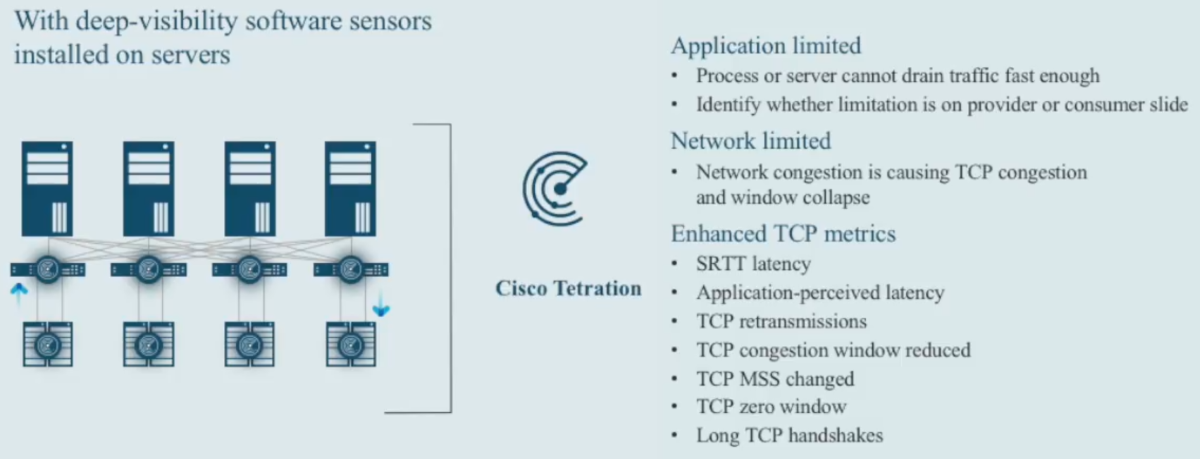
Figure 7 – Analysis Using Host Sensors
Especially the enhanced TCP metrics sound very interesting, and I would love to see what the Tetration agent really can do with those values. In theory it would be very nice to be able to pinpoint a problem that way.
There is also a possibility to configure network performance alerts, which can take a lot of different parameters into account, e.g.:
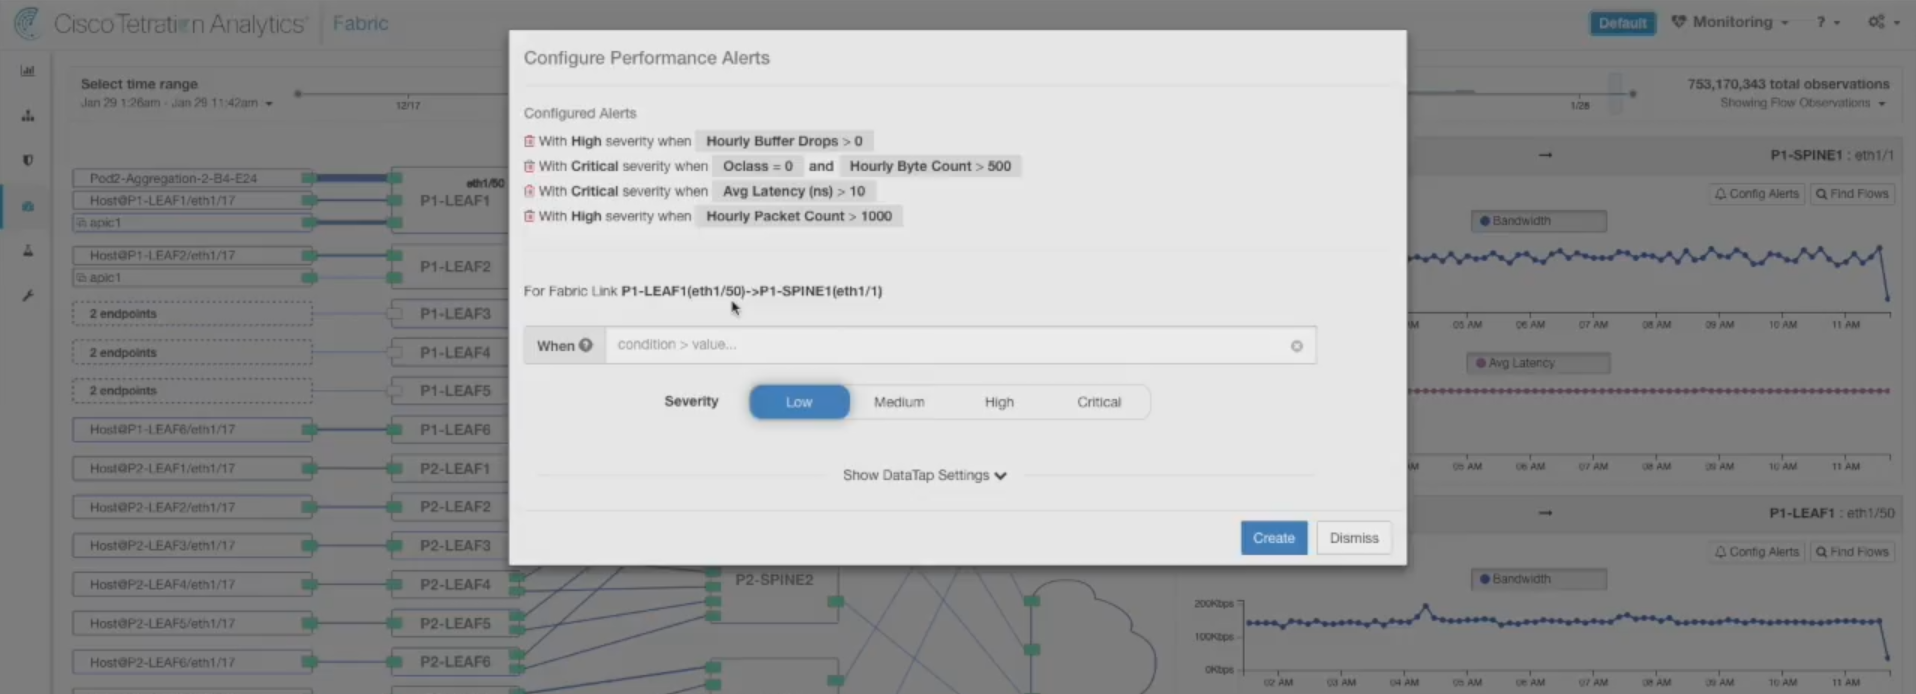
Figure 8 – Configuring Performance Alerts
Final words
Tetration looks like a powerful solution when it comes to monitoring large scale, heterogeneous networks and enforcing security policies between devices. My impression from Cisco Live EU 2017 had been that Tetration is only useful if your network has those Nexus 9000 switches, which means that this is a solution for large enterprises (looking at the deployment sizing of a full rack I still do, at least for the big deployment 🙂 ). Interestingly enough I met a sales engineer during the social media event at Cisco Live EU 2018, and she told me that she does a lot of Tetration deployments. And most of those customers do not have any Nexus 9000 switches, but use the host agents for telemetry and enforcement, which makes much more sense after having seen the new features in Tetration at Cisco Live EU 2018.
Regarding the host sensor analysis features show in Figure 7: personally, I only believe into results of an analysis system (like Tetration) in regard to network analysis related findings when I have seen its results while being able to compare it to a packet capture taken at the same time in Wireshark. Because often enough, high level analysis systems get it horribly wrong because the programmers of the (choose your buzzword) “expert system/machine learning/artificial intelligence ” engine didn’t have enough network analysis know-how to get it right. I do assume Cisco has that kind of know-how, but I have personally seen another high-profile company showing absolutely bogus values in their extremely high prices enterprise monitoring systems.
Disclosure
This post is a part of my Tech Field Day post series. I was invited to this event by Gestalt IT. Gestalt IT covered travel, accommodation and food during the event duration. I did not receive any compensation for participation in this event, and I am also not obliged to blog or produce any kind of content.
Any tweets, blog articles or any other form of content I may produce are the exclusive product of my interest in technology and my will to share information with my industry peers. I will commit to share only my own point of view and analysis of the products and technologies I will be seeing/listening about during this event.
Great article – lots of detail, Thank you. I will disagree with your final thoughts statement about the usefulness is primarily if one uses Nexus 9300’s, this is incorrect. Tetration gets the greatest level of detail and accuracy from software sensors – and is the preferred method of telemetry. This also means Tetration is 100% agnostic to the network infrastructure. Customers that run the Nexus 9300’s will benefit from additional performance level information not available from other switches and can be used as a secondary telemetry source where software sensors are not an option. It is because Tetration is not tied to the network that it can see and do so much. Disclosure: I work for Cisco and specialize in Tetration.
Hi Chris,
thank you for your feedback! My final words about the usefulness regarding Nexus 9k switches was the one from 2017. So maybe I didn’t make it clear enough that I have changed my mind in the meantime 🙂
Cheers,
Jasper