Zombie Packet Mayhem!
My previous post was about one of multiple false positives a network analyst needs to keep an eye out for to avoid writing down findings in a report that weren’t really there. So when I looked at my Sharkfest traces to see what other topic I could write this post about I realized that I have already “burned” two of the other false positives in earlier posts. Well, the good thing is you don’t have to wait and can read about them right away (if you haven’t already).
The two posts I wrote regarding false positves are:
- Oversized/undersized frames and checksum errors: The drawbacks of local packet captures
- Negative delta times: The trouble with multiple capture interfaces
So with three false positives out of the way I realized that there was another that I presented at Sharkfest 2013 that was really nice, but unfortunately isn’t relevant anymore. It was about the TCP expert of Wireshark diagnosing a retransmission by mistake, instead of an out-of-order arrival. But with the work of Evan, Jörg (both Wireshark core developers) and myself we fixed it during Sharkfest 2014, which you can read about in detail here. So it’s four down now, but don’t worry, there are more.
Packet Mayhem
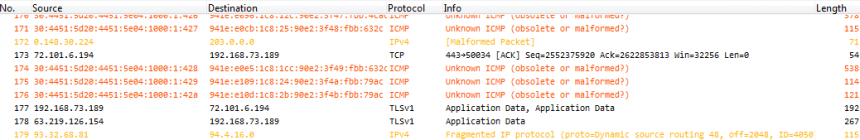
So while I was thinking about which one I was going to write about next, a capture file arrived via mail from Silvia Hagen, the well known Swiss IPv6 evangelist and book author. She had captured it on her PC while working with it, and she had a couple of topics where she liked my opinion. I have to admit I was surprised of what I saw when I opened the file in Wireshark. It looked like this:
Now this is what I call a big mess. Malformed packets, unknown ICMP, IPv4 fragmentation, source routing, IPv4 addresses with leading zero octets, and other expert messages. So I selected one of the strange frames containing IPv6 (well, it was Silvia’s trace, so I just couldn’t look at an IPv4 packet, could I? 😉 ) and took a closer look at the decode:
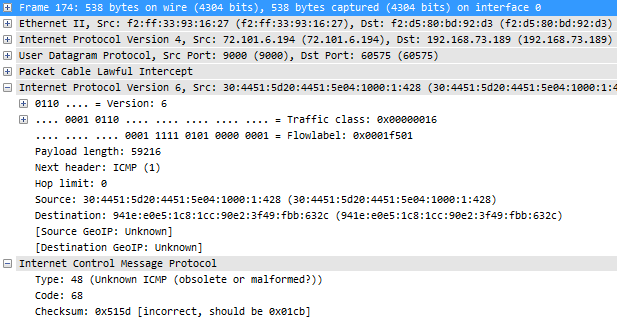
Now there’s a ton of things that are remarkable in this decode above which should be obvious to the experienced analyst. This is the list of things I noticed to be odd (don’t read the list if you want to try looking at the decode above yourself first to test your own observation skills):
- There is IPv6 carried/tunneled over IPv4, which results in a high number of protocol layers stacked on top of each other: Ethernet – IPv4 – UDP – Packet Lawful Intercept – IPv6 – ICMP. Especially the “Packet Lawful Intercept” seems odd, as you almost never see this. Especially not in a local PC capture without using special capture equipment that is almost exclusively used by law enforcement.
- The IPv6 Traffic class and Flowlabel are non-zero, which is quite uncommon
- Payload length is way too high for a normal packet (59216 bytes), but maybe it was caused by Silvia doing a local capture (which I know she did)
- Next header: ICMP (1) – now this is a real strong indicator that something is really really wrong with this trace. Why? because it’s ICMP version 4, not version 6. The protocol number 1 is reserved for IPv4 based ICMP. ICMPv6 has a protocol number of 58. You should never see ICMPv4 following an IPv6 header.
- Hop limit: zero. uh oh. Run! Run! Undead zombie packet! If the hop limit is zero the packet should have been destroyed instead of being put on the wire. What is it doing in this capture file? Very very odd. I’ve never ever seen this before.
- Source/Destination IPv6 addresses: the source address is invalid. So is the destination address. Global unicast addresses have to be in the range of 2000://3 (at least for the time being, until we wasted all that space. Come and get some!) which means that the first 16 bit block has to be somewhere between 0x2000 and 0x3fff. Well, maybe this is a zombie packet, not caring about any rules at all 🙂
- ICMP type and code: both type 48 and code 68 are reserved and not in use at all.
- Checksum: incorrect – well, this is by far the least interesting, even though IPv6 requires correct checksums in layer 4. But this could be caused by the local capture again.
Similar strange things are seen in other packets, which is hard to explain. Doing local captures is not a good idea, but usually the results aren’t this bad. So what happened?
The solution
What made me really wonder about the decode is amount of bad decodings as well as the existance of the “Packet Lawful Intercept” layer. And this was where Occam’s razor came in: if a trace looks this bad, the easiest explanation is that it probably wasn’t captured in a good way, or isn’t displayed correctly – instead of all those weird things really happening.
The first step was that I had to check how the trace had really been captured, so I checked the summary statistics:
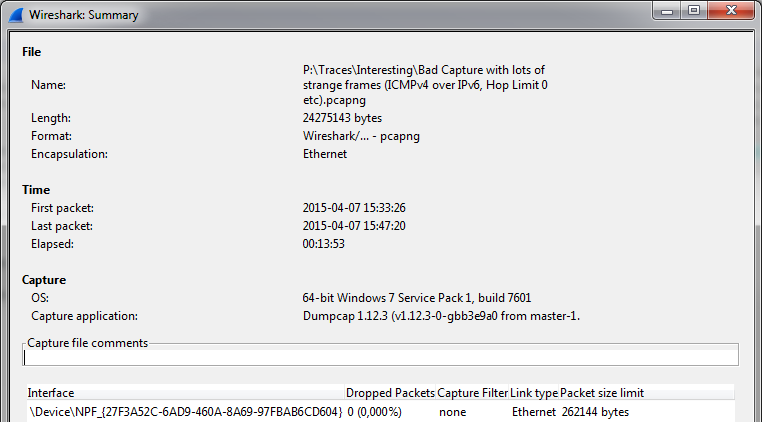
You can see the OS is a 64-bit Windows 7, and the capture application is Dumpcap 1.12.3, which is quite a recent version. All this indicates that it was really just a capture taken on a PC or a laptop, and not some special “lawful intercept” capture device. So where is this layer coming from?
So I investigated how this layer works, and with a quick search I found this Wireshark Q&A article that I had seen but forgotten about (well, as long as it turns up in an internet search I don’t have to remember about it, do I? 🙂 ) – those karma point were well earned, Graham! 🙂
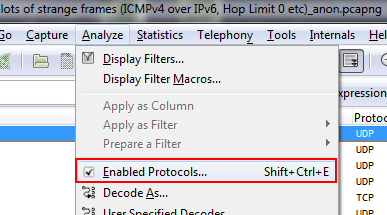
So the PCLI dissector seems to be the one making things hard to read because it kicks in when there are UDP packets using port 9000. Which is why the next step is to turn it off via the “Analyze” menu:
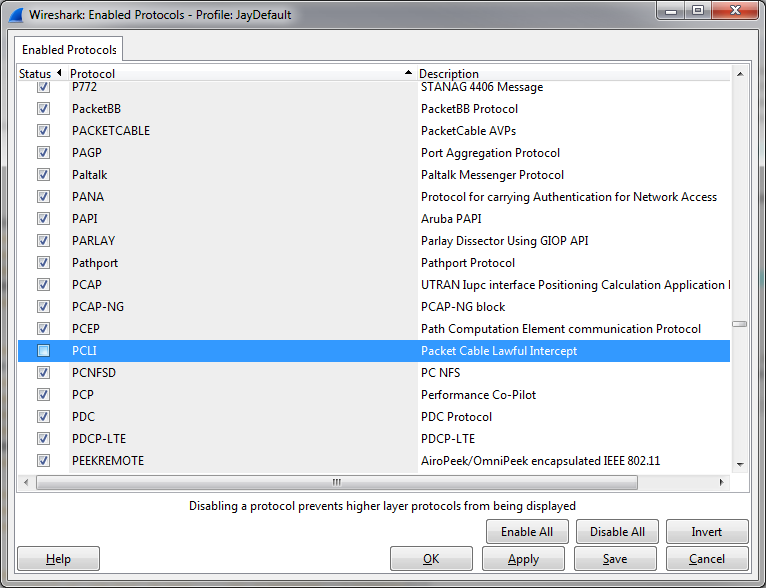
A dialog box opens and I scrolled down until I found the checkbox for PCLI, which I unchecked:
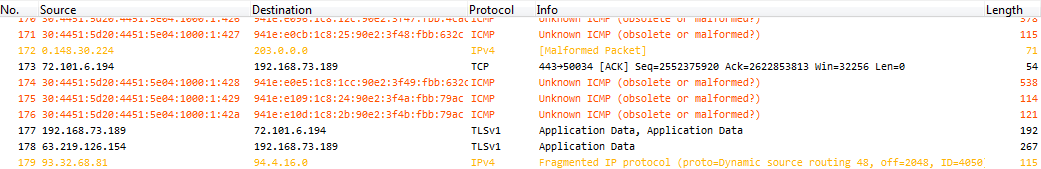
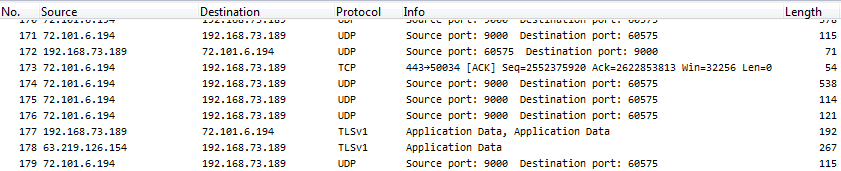
After applying the new setting the capture file looks completely different, especially since there’ no more bogus IPv6 layer showing up (all the color filters are quiet now):
You can probably leave the PCLI dissector disabled in your default profile, unless you know that you’re going to have to work with real capture files containing that protocol layer (which most of you probably don’t).
Occam’s razor
If a capture file looks really broken, with values that you have absolutely no explanation for and that should never be seen on a network, check if it’s captured and decoded correctly. I had another case like this during the 31c3 conference in Hamburg end of 2014 where my opinion was asked regarding a capture file that had packets coming and going to loopback addresses. It turned out that it had been taken locally on a Macbook, recording application behavior – but it wasn’t what ended up on the wire, so most of the network layer information was bogus.
So if in doubt, the steps are:
- verify the capture setup. The capture file quality heavily depends on how the packets were captured. If in doubt, do another capture and use a TAP.
- if the capture setup isn’t the problem, check the active dissectors. Maybe some dissector kicks in by mistake, so turn them off to see if helps (which isn’t always easy, because you need to find out the name in the analyze dialog first – reading the code may be required)
- if all of this isn’t the problem you’ve probably got the real deal
Helper: the capture setup ranking
In case you’re wondering which kind of capture setup is the best I have a small list for you, from worst to most exact:
- Local capture: bad, because lot’s of strange side effects can show up. Only use it for simple things.
- SPAN port: okay in most situations, but not if you need to check exact timings, packet loss behavior or packet reordering. It can also have an impact on the production links, delaying packets.
- Aggregation TAP: totally fine as long as the combined RX/TX load on the wire is less than that monitor capture speed of the TAP. This means that the total aggregated load needs to be less than the monitor device receive at all times. Otherwise there’s packet loss, making the capture less useful.
- Full duplex TAP: most exact, but requires a commercial (usually expensive, compared to a standard PC) capture device that can handle capturing two links simultaneously and preserve that exact output
Discussions — No responses yet