Firewall trouble
A few days ago my connection(s) to the computing center suddenly degraded, meaning that I suddenly could not contact some of my servers anymore or only after waiting for sometimes minutes, while others worked fine. I checked the Icinga monitoring system and saw that everything was fine, except the firewall, which seemed to have a lot more latency than usual when forwarding packets. Then, my provider sent me and email that his own monitoring system was seeing problems with my firewall, too, and shortly after that a SMS arrived telling me that it seemed to have gone belly up. Uh oh.
So I started to check what was going on. I had to wait for a while, but I managed to get a connection to the firewall administration interface – which was a relief because it meant the firewall was still running, even if not really good at the time. I checked everything I could think off in that moment: CPU utilization, network throughput, memory state etc, but nothing seemed to be the problem. Still, I could ping Google and other external sites only every once in a while from the servers, so there was something wrong with the network connection.
I started thinking about simply rebooting the firewall, but I knew from experience that it uses to run for months and sometimes years without downtime (well, until the next unexpected power blackout hits the computing center, which is indeed a very rare thing). And rebooting the firewall would kill all states and some of the servers would not be happy about that. So I checked how many states there were and suddenly I had a pretty good idea where things were going wrong – usually the firewall held about 10.000 states at most, with the usual up and down from night to day and back. When I looked at the state table it had more than 47.000 states, so it was already beyond the default limit of 47.000 concurrent states. I checked to see where the flood of states came from and saw that it was a single server that was part of a web application cluster, trying to send some sort of reporting data to a remote location.
It turned out that the server at the remote location was accepting incoming TCP handshakes, but then each and every connection became inactive without sending a reset or fin bit. That lead to the firewall state being kept for 24 hours, piling up until the maximum was reached. After that, only when an old connection state was freed a new connection could take its place, which was the reason why sometimes new connections worked and very often they didn’t. It also explained while already existing connections were still “alive”, since they’d made it into the state table before it got slammed with useless entries. An example can be seen in the next Wireshark screenshot. It’s nice to see how a lot of SYN packets just don’t make it through until – after a long time – finally one succeeds when another old state times out and becomes available. Which, in this case, had to be one of the “normal” states, and they were getting rarer by the minute.
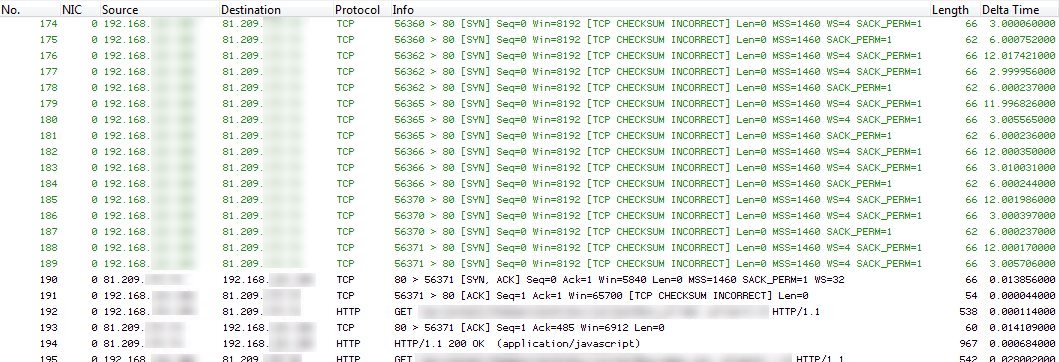
Fig.1 – Wireshark Sample Trace
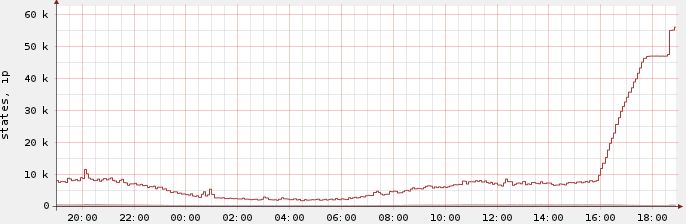
In the end I increased the number of firewall states to a much higher number, and instantly the pain went away – even though the server kept adding outgoing connections until the state table reached about 62k states.The fun thing is when you look at the state graph you can easily see where it got stuck at 47k before more states were allowed:
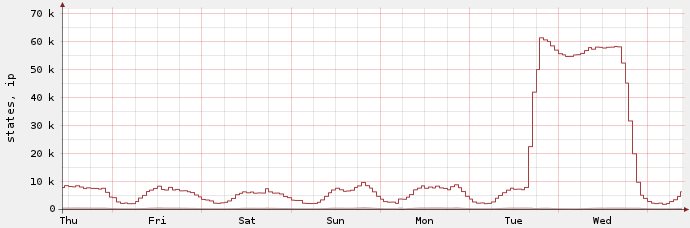
And since the firewall kept established states for 24 hours by default it took about a day until the state count went back down to normal – even though all of those annoying states were completely inactive after the three way handshake. A day later the graph finally looked like this:
In retrospect the whole thing reminded me of a network analysis incident I had performed a couple of years ago, where a customer had called me at 10:30pm saying that his firewall was being attacked. I had packed my gigabit sniffing equipment and driven to the customer site very early next morning to find out what was happening. In the end it turned out that it was just a problem with their NAT setup – they had way to many connections going out through one single NAT IP and the table got overloaded by the users surfing the internet after a couple of hours each day. Over night, when people went home, the states were freed and the firewall was happy again. So it was some sort of a home grown DDoS, similar to the state thing I just witnessed. I would have thought of that sooner but I don’t use NAT.
Lessons learned: I’m going to monitor the state count more closely and make a mental note to check it first when anything like this happens again. Oh, and I have to get that trace anonymization tool done soon, so I can stop having to blur trace screen shots when I want to share something like this on this blog 😉
Discussions — No responses yet